. 2008 Mar 19;3(3):e1839.
doi: 10.1371/journal.pone.0001839.

Population-wide emergence of antiviral resistance during pandemic influenza

Affiliations

Population-wide emergence of antiviral resistance during pandemic influenza

Seyed M Moghadas et al. PLoS One. .

Abstract

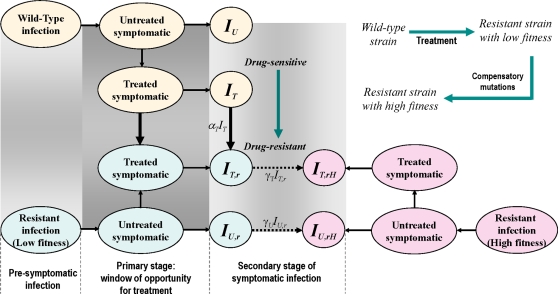
Background: The emergence of neuraminidase inhibitor resistance has raised concerns about the prudent use of antiviral drugs in response to the next influenza pandemic. While resistant strains may initially emerge with compromised viral fitness, mutations that largely compensate for this impaired fitness can arise. Understanding the extent to which these mutations affect the spread of disease in the population can have important implications for developing pandemic plans.

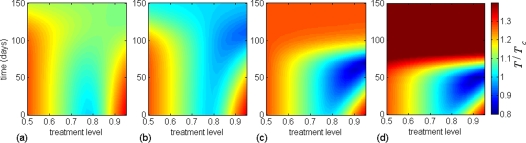
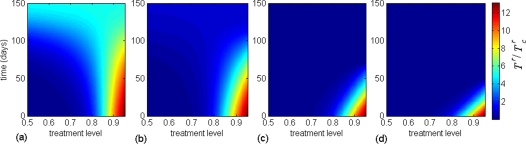
Methodology/principal findings: By employing a deterministic mathematical model, we investigate possible scenarios for the emergence of population-wide resistance in the presence of antiviral drugs. The results show that if the treatment level (the fraction of clinical infections which receives treatment) is maintained constant during the course of the outbreak, there is an optimal level that minimizes the final size of the pandemic. However, aggressive treatment above the optimal level can substantially promote the spread of highly transmissible resistant mutants and increase the total number of infections. We demonstrate that resistant outbreaks can occur more readily when the spread of disease is further delayed by applying other curtailing measures, even if treatment levels are kept modest. However, by changing treatment levels over the course of the pandemic, it is possible to reduce the final size of the pandemic below the minimum achieved at the optimal constant level. This reduction can occur with low treatment levels during the early stages of the pandemic, followed by a sharp increase in drug-use before the virus becomes widely spread.

Conclusions/significance: Our findings suggest that an adaptive antiviral strategy with conservative initial treatment levels, followed by a timely increase in the scale of drug-use, can minimize the final size of a pandemic while preventing large outbreaks of resistant infections.


Conflict of interest statement

Competing Interests: The authors have declared that no competing interests exist.

Figures

Figure 1
Figure 1. Model structure for the emergence of drug-resistance during treatment of symptomatic infections.
The clinical course of disease is divided into three stages: pre-symptomatic; primary; and secondary stages of symptomatic infections. Drug-resistance with low transmission fitness can emerge during treatment of individuals infected with the wild-type virus. It is assumed that compensatory mutations may result in generation of resistant mutants with high transmission fitness during the secondary stage of treated symptomatic infection. The compartments of untreated and treated individuals infected with the wild-type strain are represented by IU and IT, respectively. The corresponding compartments for the resistant strain with low (high) transmission fitness are denoted by sub-index r (rH).
Figure 2
Figure 2. Time-courses of clinical infections with one day delay in onset of treatment of indexed cases, with .
Simulations were run, when a single case infected with the wild-type virus is introduced into the susceptible population of size S 0 = 100 000. Treatment levels are: (a) 50%; (b) 78%; (c) 90%; and (d) 95%. The corresponding reproduction numbers of the wild-type strain are: (a) formula image; (b) formula image; (c) formula image; and (d) formula image.
Figure 3
Figure 3
(a) Total number of clinical infections caused by the wild-type, low fitness resistant, and high fitness resistant strains; (b) Total number of deaths; (c) Total number of clinical infections caused by the low fitness resistant strains; (d) Total number of clinical infections caused by the high fitness resistant strains, as a function of treatment level. Treatment of infected individuals begins one day after the onset of clinical disease; red and black curves correspond, respectively, to the reproduction numbers formula image (formula image, formula image) and formula image (formula image). Dashed curves in (a) and (b) correspond to the scenario in which no compensatory mutations occur, and resistant mutants are only present at low fitness cost.
Figure 4
Figure 4. Sensitivity analysis showing box plots for the variations in the optimal constant treatment level (below 90%) as a function of δrH, with other parameters sampled from their respective ranges, as described in “Text S1”.
The solid curve passes through the median values of the treatment level, and each box contains 50% of data points between the first and third quartiles of the sampling distribution. The remaining 50% of data points are represented by whiskers.
Figure 5
Figure 5. The effect of changing treatment level during a pandemic on the total number of clinical infections caused by all strains, with .
Simulations were seeded with an initial treatment level of (a) 85%; (b) 78% (optimal level); (c) 50%; (d) 25%, and then changed to the level shown on the horizontal axis at the time displayed on the vertical axis (corresponding to the time-course of the epidemic). The color bars illustrate the total number of clinical cases due to all strains, relative to that generated when the optimal constant treatment level (78% in this case) is implemented.
Figure 6
Figure 6. The effect of changing treatment level during a pandemic on the total number of clinical infections caused by the high fitness resistant strain, with .
Simulations were seeded with an initial treatment level of (a) 85%; (b) 78% (optimal level); (c) 50%; (d) 25%, and then changed to the level shown on the horizontal axis at the time displayed on the vertical axis (corresponding to the time-course of the epidemic). The color bars illustrate the total number of clinical infections due to the resistant strain with high transmission fitness, relative to that generated when the optimal constant treatment level (78% in this case) is implemented.
Figure 7
Figure 7. Time-courses of clinical infections with one day delay in onset of treatment of indexed cases for .
Simulations were run, when a single case infected with the wild-type virus is introduced into the susceptible population of size S 0 = 100 000. Treatment in (a) is maintained at the optimal level (78%) for the entire course of the outbreak. Treatment in (b) is initiated at a 25% level for the first 50 days (shaded area), and then increased to 90% for the rest of the outbreak. All other parameters are the same as those used for simulations in Figure 2.

References

    1. Ferguson NM, Cummings DAT, Cauchemez S, Fraser C, Riley S, et al. Strategies for containing an emerging influenza pandemic in Southeast Asia. Nature. 2005;437:209–214. - PubMed
    1. Ferguson NM, Cummings DA, Fraser C, Cajka JC, Cooley PC, et al. Strategies for mitigating an influenza pandemic. Nature. 2006;442:448–452. - PMC - PubMed
    1. Ferguson NM, Mallett S, Jackson H, Roberts N, Ward P. A population-dynamic model for evaluating the potential spread of drug-resistant influenza virus infections during community-based use of antivirals. J Antimicrob Chemother. 2003;51:977–990. - PubMed
    1. Gani R, Hughes H, Fleming D, Griffin T, Medlock J, et al. Potential impact of antiviral drug use during influenza pandemic. Emerg Infect Dis. 2005;11:1355–1362. - PMC - PubMed
    1. Germann TC, Kadau K, Longini IM, Jr, Macken CA. Mitigation strategies for pandemic influenza in the United States. Proc Natl Acad Sci USA. 2006;103:5935–5940. - PMC - PubMed

Publication types