

High-field solution NMR spectroscopy as a tool for assessing protein interactions with small molecule ligands
- PMID: 18351634
- PMCID: PMC3713473
- DOI: 10.1002/jps.21378
High-field solution NMR spectroscopy as a tool for assessing protein interactions with small molecule ligands
Abstract
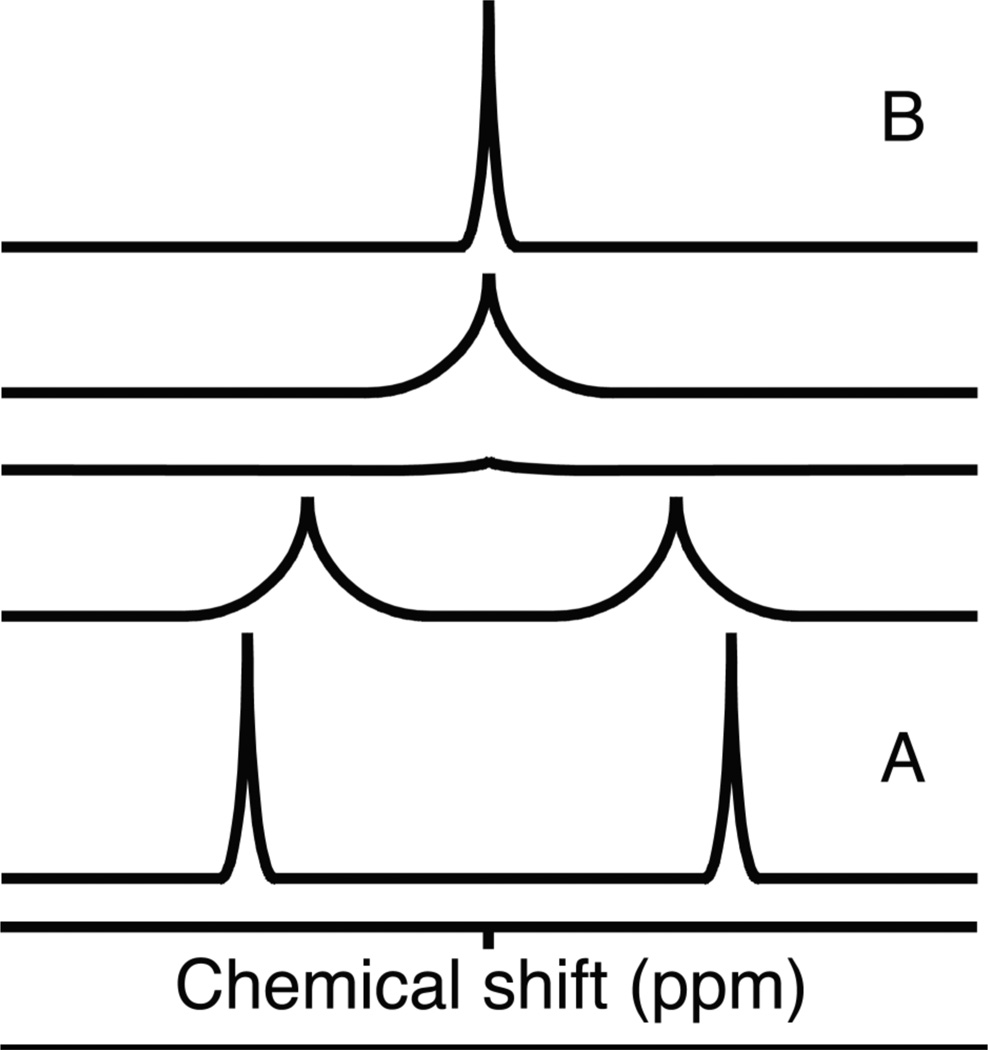
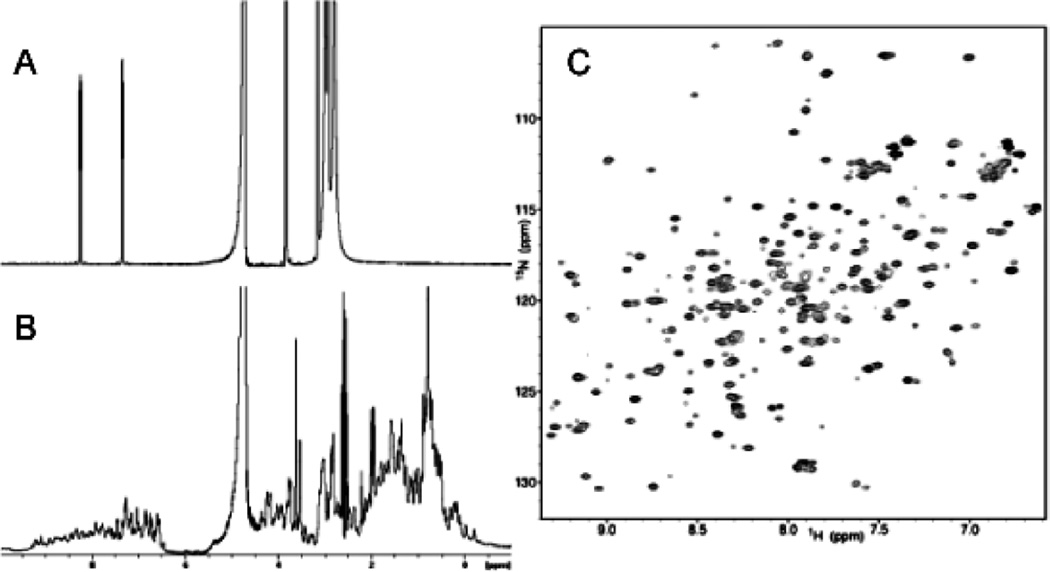
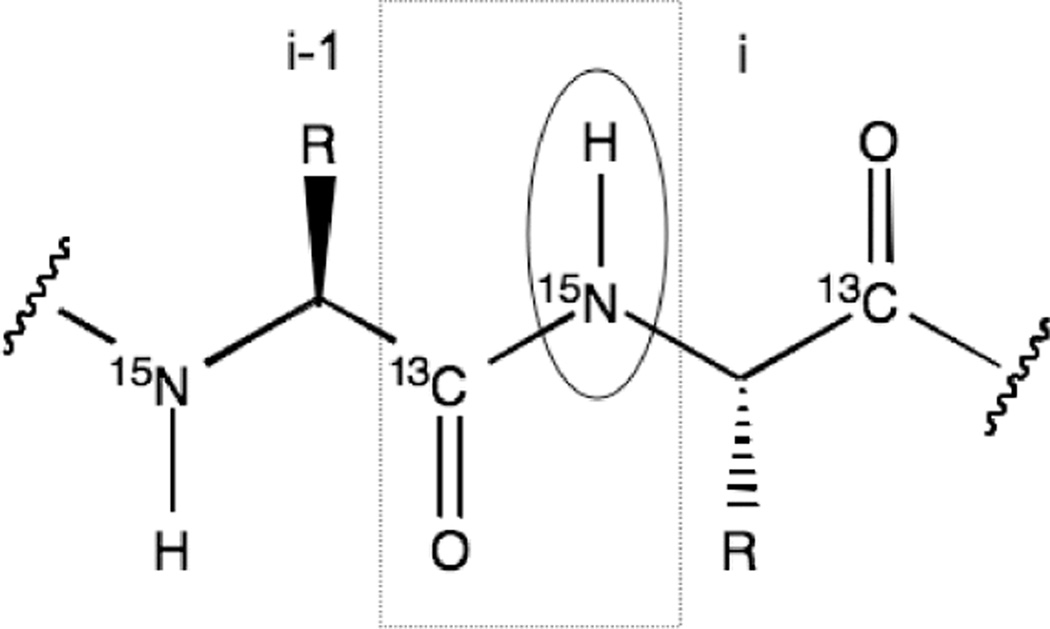
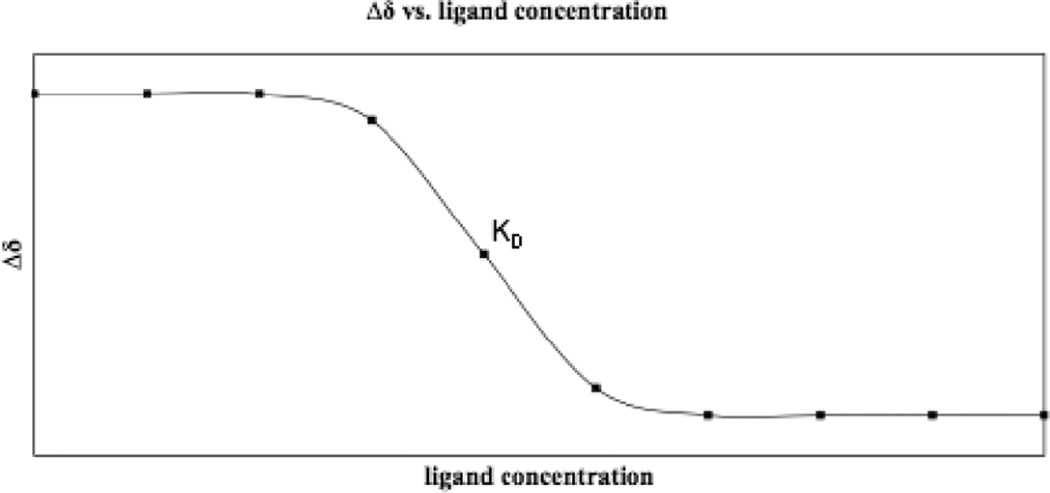
The ability of a small molecule to bind and modify the activity of a protein target at a specific site greatly impacts the success of drugs in the pharmaceutical industry. One of the most important tools for evaluating these interactions has been high-field solution nuclear magnetic resonance (NMR) because of its unique ability to examine even weak protein-drug interactions at high resolution. NMR can be used to evaluate the structural, thermodynamic and kinetic aspects of a binding reaction. The basis of NMR screening experiments is that binding causes a perturbation in the physical properties of both molecules. Unique properties of small and macromolecules allow selective detection of either the protein target or ligand, even in a mixture of compounds. This review outlines current methodologies for assessing protein-ligand interactions from the perspectives of the protein target and ligand and delineates the fundamental principles for understanding NMR approaches in drug research. Advances in instrumentation, pulse sequences, isotopic labeling strategies, and the development of competition experiments support the study of higher molecular weight protein targets, facilitate higher-throughput and expand the range of binding affinities that can be evaluated, enhancing the utility of NMR for identifying and characterizing potential therapeutics to druggable protein targets.
Figures
Similar articles
-
ID NMR Methods in ligand-receptor interactions.Curr Top Med Chem. 2003;3(1):25-37. doi: 10.2174/1568026033392750. Curr Top Med Chem. 2003. PMID: 12577989 Review.
-
Protein NMR-based screening in drug discovery.Curr Pharm Des. 2006;12(31):3963-72. doi: 10.2174/138161206778743619. Curr Pharm Des. 2006. PMID: 17100607 Review.
-
Investigating Protein-Ligand Interactions by Solution Nuclear Magnetic Resonance Spectroscopy.Chemphyschem. 2018 Apr 17;19(8):895-906. doi: 10.1002/cphc.201701253. Epub 2018 Feb 16. Chemphyschem. 2018. PMID: 29314603 Free PMC article. Review.
-
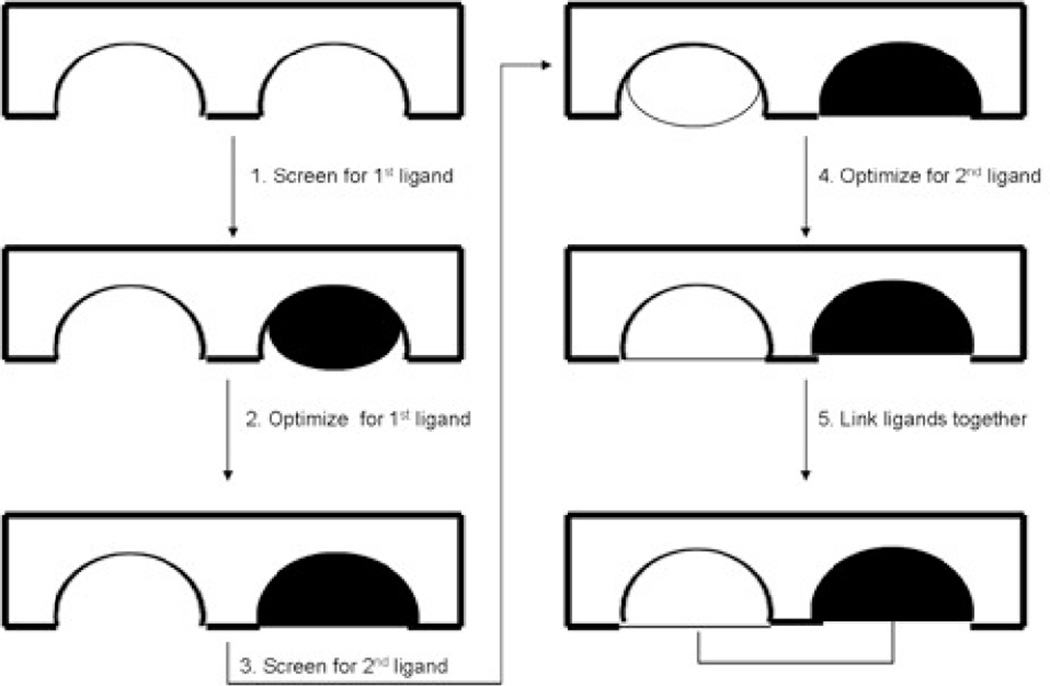
Second-site NMR screening and linker design.Curr Top Med Chem. 2003;3(1):69-80. doi: 10.2174/1568026033392778. Curr Top Med Chem. 2003. PMID: 12570778 Review.
-
Automation of biomolecular NMR screening.Curr Top Med Chem. 2003;3(1):55-67. doi: 10.2174/1568026033392688. Curr Top Med Chem. 2003. PMID: 12570777 Review.
Cited by
-
Drug screening strategy for human membrane proteins: from NMR protein backbone structure to in silica- and NMR-screened hits.Biochem Biophys Res Commun. 2014 Mar 21;445(4):724-33. doi: 10.1016/j.bbrc.2014.01.179. Epub 2014 Feb 10. Biochem Biophys Res Commun. 2014. PMID: 24525125 Free PMC article.
-
Durable bonds at the adhesive/dentin interface: an impossible mission or simply a moving target?Braz Dent Sci. 2012 Jan;15(1):4-18. doi: 10.14295/bds.2012.v15i1.790. Braz Dent Sci. 2012. PMID: 24855586 Free PMC article.
-
Small molecule inhibitors against PD-1/PD-L1 immune checkpoints and current methodologies for their development: a review.Cancer Cell Int. 2021 Apr 27;21(1):239. doi: 10.1186/s12935-021-01946-4. Cancer Cell Int. 2021. PMID: 33906641 Free PMC article. Review.
-
Protein-Inhibitor Interaction Studies Using NMR.Appl NMR Spectrosc. 2015;1:143-181. doi: 10.2174/9781608059621115010007. Appl NMR Spectrosc. 2015. PMID: 26361636 Free PMC article.
-
Intracellular Concentration Gradients That Mirror External Gradients in Microfluidic Flows: A Computational Analysis.Cell Mol Bioeng. 2016 Dec 16;10(2):198-207. doi: 10.1007/s12195-016-0474-3. eCollection 2017 Apr. Cell Mol Bioeng. 2016. PMID: 31719860 Free PMC article.
References
-
- Hopkins AL, Groom CR. The druggable genome. Nat Rev Drug Discov. 2002;1(9):727–730. - PubMed
-
- Mulder FA, Hon B, Muhandiram DR, Dahlquist FW, Kay LE. Flexibitility and ligand exchange in a buried cavity mutant of T4 lysozyme studied by multinuclear NMR. Biochem. 2000;39:12614–12622. - PubMed
-
- Wyss DF, McCoy MA, Senior MM. NMR-Based Approaches for Lead Discovery. Curr Opin Drug Discov Devel. 2002;5:630–647. - PubMed
-
- Coles M, Heller M, Kessler H. NMR-based Screening Technologies. Drug Discov Today. 2003;8:803–810. - PubMed
-
- Jahnke W. Spin labels as a tool to identify and characterize protein-ligand interactions by NMR spectroscopy. Chembiochem. 2002;3(2–3):167–173. - PubMed
Publication types
MeSH terms
Substances
Grants and funding
LinkOut - more resources
Full Text Sources
Other Literature Sources
Medical
