. 2008 Jul 1;413(1):185-91.
doi: 10.1042/BJ20071643.

Hydrogen peroxide mediates the radiation-induced mutator phenotype in mammalian cells

Affiliations

Hydrogen peroxide mediates the radiation-induced mutator phenotype in mammalian cells

Disha Dayal et al. Biochem J. .

Abstract

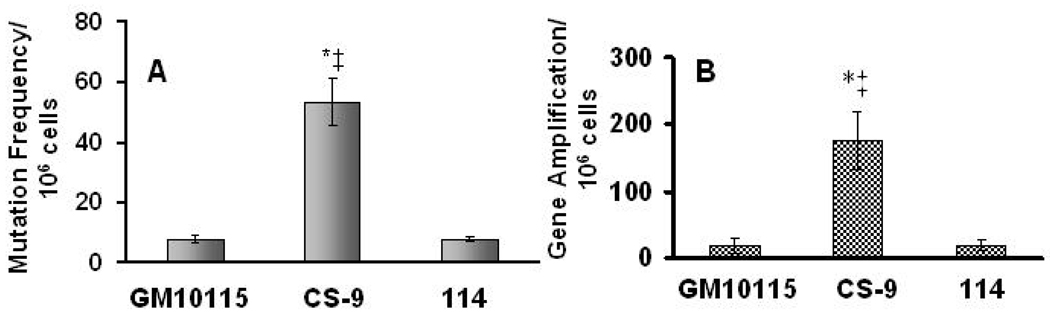
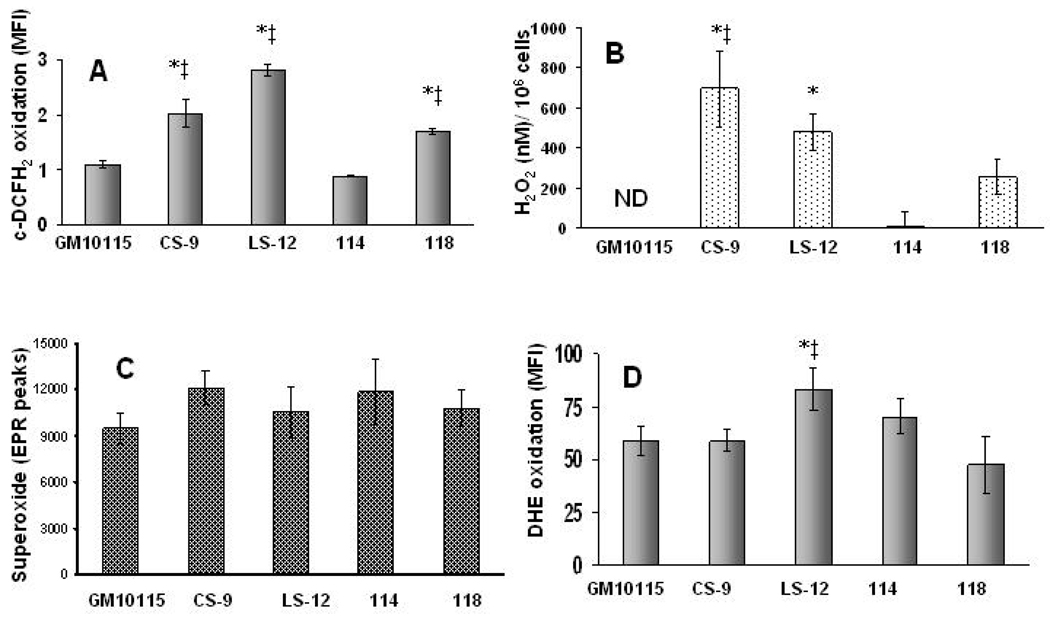
Chronic oxidative stress has been associated with genomic instability following exposure to ionizing radiation. However, results showing direct causal linkages between specific ROS (reactive oxygen species) and the ionizing radiation-induced mutator phenotype are lacking. The present study demonstrates that ionizing radiation-induced genomically unstable cells (characterized by chromosomal instability and an increase in mutation and gene amplification frequencies) show a 3-fold increase in steady-state levels of hydrogen peroxide, but not superoxide. Furthermore, stable clones isolated from parallel studies showed significant increases in catalase and GPx (glutathione peroxidase) activity. Treatment of unstable cells with PEG-CAT (polyethylene glycol-conjugated catalase) reduced the mutation frequency and mutation rate in a dose-dependent fashion. In addition, inhibiting catalase activity in the stable clones using AT (3-aminotriazole) increased mutation frequency and rate. These results clearly demonstrate the causal relationship between chronic oxidative stress mediated by hydrogen peroxide and the mutator phenotype that persists for many generations following exposure of mammalian cells to ionizing radiation.


Figures

Figure 1
Figure 1. CS-9 cells show increased genomic instability
Panel A: To measure mutation frequency, 3 × 10⁶ cells were plated in 100 mm dishes containing complete media and 40 µM 6-thioguanine. Dishes were left undisturbed in a 37°C incubator and colonies were counted after 2 weeks. Error bars represent ± 1 SD from 5 treatment dishes. p<0.01 * vs wild-type, ‡ vs 114. Panel B: To measure CAD gene amplification, 0.35 × 10⁶ cells were plated on a 100 mm dish and media containing 100 µM PALA was added. Colonies were counted after 2 weeks. The error bars represent ± 1 SD from 6 dishes for GM10115 and CS-9, and 3 separate dishes for 114. p<0.01 * vs wild-type, ‡ vs 114.
Figure 2
Figure 2. Genomically unstable clones show increased steady-state levels of ROS
Panel A: Intracellular pro-oxidant status of cells was assessed using c-DCFH2 staining. Cells were labeled with 10 µg/mL c-DCFH2 for 15 min at 37°C. Error bars represent ± 1 SD from 3 dishes. p<0.05 * vs wild-type, ‡ vs 114. Panel B: H2O2 produced by cells was measured in the medium using the catalase inhibitable p-HPA fluorescence. The error bars represent ± SEM of 6 dishes. ND stands for non-detectable. p<0.05 * vs wild-type, ‡ vs 114. Panel C: Superoxide was measured as the SOD inhibitable DMPO-OH EPR signal from isolated mitochondria from each cell line. The error bars represent ± SEM from 3 independently harvested samples. No statistical difference between cell lines was detected (p>0.05). Panel D: Estimation of intracellular superoxide using DHE oxidation. Cells were labeled with 10 µM DHE at 37°C for 40 min. Error bars represent ± 1 SD of 5 dishes from each cell line. p<0.05 * vs wild-type, ‡ vs 118.
Figure 3
Figure 3. Hydroperoxide scavenging enzyme activity is increased in genomically stable clones
Panel A: Glutathione peroxidase (GPx) and catalase activities were analyzed in cell homogenates and normalized to protein content. Data are represented as a fold change relative to the GM10115. The error bars for GPx activity represent ± 1 SD from 4 samples. p<0.05 * vs wild-type, ‡ vs CS-9. The error bars for catalase activity represent ± 1 SD from 3 independently harvested samples from each group. p<0.05 * vs wild-type, ‡ vs CS-9. Panel B: GSH was measured using the DTNB-recycling assay. Error bars represent ± 1 SD from 5 samples. p<0.05, * vs GM10115, ‡ vs CS-9 Panel C: Using data in panel A and C, effective GPx activity was calculated [19]. The errors in the GPx and GSH measurements were used to calculate the error for the effective GPx measurement using propagation of error theory. p<0.05, * vs GM10115, ‡ vs CS-9. Panel D: CuZnSOD and MnSOD activities were measured in whole cell lysates using inhibition of NBT reduction as an indicator. Error bars represent ± 1 SD from 4 samples. No statistical differences were noted among the groups (p>0.05).
Figure 4
Figure 4. H2O2 causes radiation-induced delayed mutagenesis
Panel A: PEG-catalase (100 U/mL) was added to CS-9 cells 2 h prior to the addition of 6-thioguanine during the mutation frequency assay and left for 2-weeks. The results represent ± 1 SD from 4 samples. p<0.001 * vs CS-9. Panel B: The suppressive effect that PEG Cat had on mutation frequency in CS-9 was dose dependent. The results represent the average of 2 samples in the 25 U/mL as well as 50 U/mL group and 4 samples done in the 100 U/mL group. Panel C: The stable clone114 was grown in presence of 3-aminotriazole for 4 days. On the fourth day, treated cells were plated in presence of 6-thioguanine for the mutation frequency assay. The error bars represent ± 1 SD from 3 experiments. p<0.01 * vs 114. Panel D: The mutation rate in stable and unstable cells with or without manipulation to catalase activity was determined following selection in HAT media. The rates represent mutation frequency/106 cells/day. Each data set represents the average of 3 separate dishes. p<0.05, * vs GM10115, ‡ vs CS-9, £ vs 114, ε vs 118.
Figure 5
Figure 5. Model by which oxidative metabolism can be incorporated into the mutator phenotype hypothesis to explain the progression of radiation-induced genomic instability

References

    1. Morgan WF. Non-targeted and delayed effects of exposure to ionizing radiation: II. radiation-induced genomic instability and bystander effects in vivo, clastogenic factors and transgenerational effects. Rad. Res. 2003;159:581–596. - PubMed
    1. Azzam EI, de Toledo SM, Spitz DR, Little JB. Oxidative metabolism modulates signal transduction and micronucleus formation in bystander cells from alpha-particle-irradiated normal human fibroblast cultures. Cancer Res. 2002;62:5436–5442. - PubMed
    1. Hunt CR, Sim JE, Sullivan SJ, Featherstone T, Golden W, Von Kapp-Herr C, Hock RA, Gomez RA, Parsian AJ, Spitz DR. Genomic instability and catalase gene amplification induced by chronic exposure to oxidative stress. Cancer Res. 1998;58:3986–3992. - PubMed
    1. Clutton SM, Townsend KM, Walker C, Ansell JD, Wright EG. Radiation-induced genomic instability and persisting oxidative stress in primary bone marrow cultures. Carcinogenesis. 1996;17:1633–1639. - PubMed
    1. Limoli CL, Giedzinski E. Induction of chromosomal instability by chronic oxidative stress. Neoplasia. 2003;5:339–346. - PMC - PubMed

Publication types