. 2008 Jun;83(6):1541-50.
doi: 10.1189/jlb.1207838. Epub 2008 Mar 19.

Endotoxemia down-regulates bone marrow lymphopoiesis but stimulates myelopoiesis: the effect of G6PD deficiency

Affiliations

Endotoxemia down-regulates bone marrow lymphopoiesis but stimulates myelopoiesis: the effect of G6PD deficiency

Rachna Chandra et al. J Leukoc Biol. 2008 Jun.

Abstract

Bone marrow (BM) dysfunction is an important component of immunomodulation. This study investigated alterations in cell content, apoptotic responses, and cell proliferation in BM, blood, and spleen in endotoxemic mice (LPS from Escherichia coli). As the decreased antioxidant status associated with glucose-6-phosphate dehydrogenase (G6PD) deficiency has been shown to modulate the innate immune response, we also tested whether a G6PD mutation (80% decrease in cellular enzyme activity) alters BM responses during endotoxemia. LPS decreased BM myeloid (CD45(+)CD11b(+)) and B lymphoid (CD45(+)CD19(+)CD11b(-)) cell content compared with controls. In contrast, LPS increased CD11b(+) myeloid but decreased T and B cell counts in the circulation. Endotoxemia inhibited spontaneous, heat shock, and H(2)O(2)-induced apoptosis as well as proliferative activity in BM lymphoid cells. In contrast, BM myeloid cell apoptosis was not altered, and their proliferative activity was increased during endotoxemia. Following LPS, splenic myeloid cell content was increased, and T and B cell content was unchanged; furthermore, splenocytes showed increased apoptosis compared with controls. BM cell content, including lymphoid and myeloid cells, was greater in G6PD mutant than wild-type (WT) mice, and LPS decreased BM cell counts to a greater degree in mutant than WT mice. Endotoxemia caused widespread inhibition of BM cytokine and chemokine production; however, IL-6 production was increased compared with controls. LPS-induced IL-6 production was decreased in G6PD mutant animals compared with WT. This study indicates that endotoxin inversely affects BM myeloid and lymphoid cell production. LPS-induced down-regulation of B cell production contributes to the generalized lymphopenia and lymphocyte dysfunction observed following nonspecific immune challenges.


Figures

Fig. 1
Fig. 1
Endotoxemia increases the number of circulating neutrophils but depletes T and B lymphocytes. Twenty-four hours after LPS or saline injection (controls), blood was collected, and total WBC and platelet counts were determined (A and B). (C–F) Numbers of circulating CD11b+ (mostly neutrophils) and different T cell (CD4+ and CD8+) and B cell (CD19+) subsets as indicated. Numbers within the bars depict the mean values of percent cell distributions. Flow cytometry panels on the right show typical findings from a WT animal. *, Statistically significant difference as compared with control within the same genotype. Mean ± SEM; n = 7–8 animals in each group. SSC, Side-scatter.
Fig. 2
Fig. 2
Endotoxemia increases neutrophil and macrophage infiltration into spleen. Twenty-four hours after LPS or saline injection, splenocyte suspensions were prepared, and cell counts were determined (A). Based on CD11b+ staining and light-scatter properties, neutrophil and macrophage numbers as well as CD4+ or CD8+ T cells and CD19+ B cell counts were calculated from total cell yields and the percent distribution of these cell populations (B–F). *, Statistically significant difference as compared with control within the same genotype. Mean ± SEM; n = 7–8 animals in each group.
Fig. 3
Fig. 3
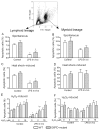
Endotoxemia down-regulates BM hematopoiesis. Twenty-four hours after LPS or saline injection, BM cell suspensions were prepared, and cell counts were determined (A). Following the incubations with a set of surface markers as described in Materials and Methods, BM content for different cellular subsets was determined by flow cytometry. B lymphoid cells were CD45+CD19+/CD11b(R1 and R2, B and D), whereas myeloid cells were CD45+CD11b+CD19 (R3, C). Cells with scattered staining for these markers are also shown (R4, E). *, Statistically significant difference as compared with control within the same genotype; &, compared with all other groups. Mean ± SEM; n = 7–8 animals in each group.
Fig. 4
Fig. 4
Erythroid cell responses following endotoxemia. Twenty-four hours after LPS or saline injection, circulating erythrocyte counts were determined (A). RBC deformability was measured by LORCA under prevailing shear stress, and KEI (shear stress causing half-maximal erythrocyte deformability) was calculated and compared (B). BM cell suspensions were also prepared, and erythroid content was determined using Ter199, CD45, and CD11b markers (C). Flow cytometry panels show a typical finding from a WT animal. #, Statistically significant difference as compared with control within the same genotype. Mean ± SEM; n = 6 animals in each group.
Fig. 5
Fig. 5
Residual lymphoid cells in endotoxin-depleted BM display resistance to apoptotic challenges. Twenty-four hours after LPS or saline injection, BM cell suspensions were prepared, and cells were incubated for 4 h at 37°C (A and B) or exposed to heat shock (C and D) or increasing concentrations of H2O2 (E and F) in parallel incubations. The number of apoptotic cells was determined by Annexin-V staining as described in Materials and Methods. The flow cytometry panel depicts a typical side/ forward scatter (FSC) from a WT animal, indicating two groups of small/less-complex and larger/more-complex populations. Based on back-gating from the experiments shown in Figure 3, these populations corresponded to the lymphoid (CD45+CD19+, panels on the left) and myeloid populations (CD45+CD11b+, panels on the right) and were analyzed accordingly. *, Statistically significant difference compared with control within the same genotype; #, compared with WT within the same treatment. Mean ± SEM; n = 8 in each group.
Fig. 6
Fig. 6
Increased splenocyte apoptosis following endotoxemia. Twenty-four hours after LPS or saline injection, splenocyte suspensions were prepared, and cells were incubated for 4 h at 37°C (A) or exposed to heat shock (B) or increasing concentrations of H2O2 (C) in parallel incubations. The number of apoptotic cells was determined by Annexin-V staining. *, Statistically significant difference compared with control within the same genotype. Mean ± SEM; n = 8 in each group.
Fig. 7
Fig. 7
De novo DNA synthesis is inhibited in B cells but increased in myeloid cells in endotoxin-depleted BM. Twenty-two hours after LPS or saline injection, in vivo BrdU incorporation was determined, as described in Materials and Methods. BM cells were isolated, and BrdU staining in combination with the surface markers used was determined in B cells (A), myeloid cells (B), and erythroid cells (C). *, Statistically significant difference compared with control within the same genotype. (D) CFUs in BM from endotoxemic or control animals after culture in GM-CSF-containing media for 2 weeks. Mean ± SEM; n = 6–8 animals for the BrdU studies, or n = 3 animals for the CFU activity studies in each group.
Fig. 8
Fig. 8
Endotoxemia down-regulates BM cytokine and chemo-kine production, except IL-6. (A and B) BM cells were prepared from control and endotoxemic WT animals, and suspension cultures of equal cell numbers were exposed to secondary LPS stimulus (100 ng/ml, 14 h). Media were collected and analyzed for cytokine content using a cytokine antibody array. Baseline (dotted line) represents values obtained in controls in the absence of in vitro LPS. (C) BM cells were prepared from an independent set of control and endotoxemic WT as well as G6PD mutant animals, and suspension cultures of equal cell numbers were exposed to LPS (100 ng/ml) or Pam3CSK4 (200 ng/ml) for 14 h. Cytokine content from conditioned media was measured by ELISA. *, Statistically significant difference compared with control within the same genotype; #, compared with endotoxemic WT in the corresponding in vitro treatment. Mean ± SEM; n = 4 in each group for cytokine arrays, or n = 8 in each group for the ELISA. sTNFR, Soluble TNF receptor; SCF, stem cell factor; VEGF, vascular endothelial growth factor; THROM, thrombopoietin.

References

    1. Remick DG, Newcomb DE, Bolgos GL, Call DR. Comparison of the mortality and inflammatory response of two models of sepsis: lipopolysaccharide vs. cecal ligation and puncture. Shock. 2000;13:110–116. - PubMed
    1. Spolarics Z, Condon MR, Siddiqi M, Machiedo GW, Deitch EA. Red blood cell dysfunction in septic glucose-6-phosphate dehydrogenase-deficient mice. Am J Physiol Heart Circ Physiol. 2004;286:H2118–H2126. - PubMed
    1. Wilmanski J, Villanueva E, Deitch EA, Spolarics Z. Glucose-6-phosphate dehydrogenase deficiency and the inflammatory response to endotoxin and polymicrobial sepsis. Crit Care Med. 2007;35:510–518. - PubMed
    1. Hotchkiss RS, Coopersmith CM, Karl IE. Prevention of lymphocyte apoptosis—a potential treatment of sepsis? Clin Infect Dis. 2005;41(Suppl 7):S465–S469. - PubMed
    1. Fonseca RB, Mohr AM, Wang L, Sifri ZC, Rameshwar P, Livingston DH. The impact of a hypercatecholamine state on erythropoiesis following severe injury and the role of IL-6. J Trauma. 2005;59:884–889. - PubMed

Publication types