. 2008 Jun;83(6):1345-53.
doi: 10.1189/jlb.0907658. Epub 2008 Mar 19.

The role of chloride anion and CFTR in killing of Pseudomonas aeruginosa by normal and CF neutrophils

Affiliations

The role of chloride anion and CFTR in killing of Pseudomonas aeruginosa by normal and CF neutrophils

Richard G Painter et al. J Leukoc Biol. 2008 Jun.

Abstract

Chloride anion is essential for myeloperoxidase (MPO) to produce hypochlorous acid (HOCl) in polymorphonuclear neutrophils (PMNs). To define whether chloride availability to PMNs affects their HOCl production and microbicidal capacity, we examined how extracellular chloride concentration affects killing of Pseudomonas aeruginosa (PsA) by normal neutrophils. PMN-mediated bacterial killing was strongly dependent on extracellular chloride concentration. Neutrophils in a chloride-deficient medium killed PsA poorly. However, as the chloride level was raised, the killing efficiency increased in a dose-dependent manner. By using specific inhibitors to selectively block NADPH oxidase, MPO, and cystic fibrosis transmembrane conductance regulator (CFTR) functions, neutrophil-mediated killing of PsA could be attributed to three distinct mechanisms: CFTR-dependent and oxidant-dependent; chloride-dependent but not CFTR- and oxidant-dependent; and independent of any of the tested factors. Therefore, chloride anion is involved in oxidant- and nonoxidant-mediated bacterial killing. We previously reported that neutrophils from CF patients are defective in chlorination of ingested bacteria, suggesting that the chloride channel defect might impair the MPO-hydrogen peroxide-chloride microbicidal function. Here, we compared the competence of killing PsA by neutrophils from normal donors and CF patients. The data demonstrate that the killing rate by CF neutrophils was significantly lower than that by normal neutrophils. CF neutrophils in a chloride-deficient environment had only one-third of the bactericidal capacity of normal neutrophils in a physiological chloride environment. These results suggest that CFTR-dependent chloride anion transport contributes significantly to killing PsA by normal neutrophils and when defective as in CF, may compromise the ability to clear PsA.


Figures

Figure 1
Figure 1. The effect of extracellular chloride on intracellular killing of PsA by normal neutrophils
Panel A Intracellular PsA killing by normal neutrophils was measured in isotonic media containing varied chloride concentrations. Neutrophils were allowed to ingest serum-opsonized PsA (20:1 PsA:PMN) in the gluconate chloride-free Ringer’s buffer containing 10 % dialyzed serum for 20 min at 37 °C for 20 min. The uningested PsA were removed by low speed centrifugation and the cell pellets resuspended in the indicated concentration of chloride-containing Ringer’s buffer containing 10% dialyzed serum. After sampling to assess the initial number of viable PsA at the 0-minute time point, the cells were then incubated with shaking at 37 °C and aliquots taken at the indicated time points (10, 20, 30 and 40 minutes). The remaining levels of PsA viability relative to the zero time point were determined. Killing of PsA was strongly dependent on chloride in the medium. The data were plotted on a semi-log scale relative to the viable bacteria present at time zero. The solid lines represent the exponential regression lines based on the equation V=e−kt, where V equals the rate of killing relative to the initial viability of PsA at time zero, t equals time in min, and k equals the first order rate constant. The rate of PsA killing follows first-order kinetics over the entire 40 min period. Panel B Statistical analysis of the rate constants of intracellular killing (% per min) by normal neutrophils in media with varied extracellular chloride levels ranged from 0 to 127 mM. The intracellular killing rate showed a strong chloride-dependence plateauing at 60 mM and higher concentrations of chloride. The data represent n=8 donors for the 0 mM and 127 mM data points and n= 3 for the points from 10-80 mM, respectively. The vertical bars represent the SEM. Panel C – The effect of extracellular chloride on superoxide production in response to phorbal myristyl acetate (PMA) stimulation. Superoxide was measured in the presence of 50 μM cytochrome c and the indicated concentration of chloride Ringer’s buffer. After adding PMA to activate the NADPH oxidase, PMNs (5 × 10⁵ in 1 ml) were placed in a cuvette and the absorbances at 550 nm measured over a 5-min period. The maximal initial rate observed per min was determined in each case and plotted as a function of extracellular chloride concentration. All data were expressed relative to the value observed in gluconate chloride-free Ringer’s buffer. Panel D – Superoxide generation in response to opsonized PsA at selected times during the killing protocol as measured by lucigenin-enhanced chemiluminescence (LucCL). In a master tube, opsonized PsA and PMN were mixed in Na gluconate Ringer’s (0 mM Chloride) buffer containing 10% dialyzed serum and incubated with shaking at 37 °C for phagocytosis for 20 minutes. As indicated, cells (250,000) in 25 μl were withdrawn at 5, 10, 15 and 20 min and mixed with 125 μM lucigenin solution at room temperature and the luminescence measured immediately. At the 20-min mark, the cell mixture was chilled on ice for 1 min and free PsA removed by low speed centrifugation. The cell pellet was resuspended in an equivalent volume of either NaCl Ringer’s buffer (127 mM chloride; open circles) or Na gluconate Ringer’s buffer (0 mM Chloride; closed circles) and followed by the 40 min killing. During this time aliquots were taken for LucCL measurements at 5, 10, 20, 30 and 40 min after the buffer change. Finally, the cells were stimulated with a final concentration of 500 ng/ml PMA and aliquots were taken at 5 min intervals for LucCL measurements.
Figure 2
Figure 2. The effect of extracellular chloride concentration on intracellular generation of HOCl by normal neutrophils
Panel A: Neutrophil-mediated bleaching of FITC-Zymosan fluorescence at 0, 63.5 and 127 mM chloride in the presence (g, i, and k) and absence (b, d, and f) of MPO inhibitor ABAH. The corresponding phase contrast micrographs are also displayed. All fluorescent micrographs were photographed at a constant exposure time without prior exposure to UV irradiation. To eliminate the possible pH effects on the fluorescence of intracellular particles, after 30 minutes of incubation the cells were resuspended in 127 mM KCl Ringer’s buffer at pH 8.2 containing 10 mM sodium azide to block further MPO activity and 7 μM nigericin and 5 μM monensin to maintain the intraphagosomal pH at 8.2 for all groups. The rationale for maintaining pH 8.2 was to obtain the maximal FITC fluorescence. Scale bars represent 100 μm. Panel B: Quantitative measurement of fluorescence of the FITC-Zymosan in neutrophils with a fluorescent microplate reader. Data represent the mean of 3 separate donors.
Figure 3
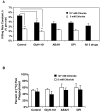
Figure 3. The effect of oxidant and CFTR inhibitors on intracellular killing of PsA and phagocytosis by normal neutrophils
Panel A: Neutrophils were treated with either vehicle solution (control), CFTR inhibitor GlyH-101 (50 μM), MPO inhibitor ABAH (200 μM) or NADPH oxidase inhibitor DPI (20 μM) for 10 min prior to addition of serum-opsonized PsA at a ratio of 20:1 (PsA:PMN). Phagocytosis was allowed to proceed for 20 min in the chloride-free Ringer’s buffer containing 10% dialyzed serum. Bacterial killing was performed in the chloride-free Ringer’s buffer (0 mM chloride) with 10% dialyzed serum (Open bars) or the chloride-rich Ringer’s buffer (127 mM chloride) with 10 % dialyzed serum (Solid bars). Inhibitors where indicated were included in the media at all times. After incubation with shaking the remaining viable bacteria were assessed at 0, 20 and 40 min and compared with that seen at time zero. The killing rate constant (% per min) was calculated by exponential curve fit as described in Figure 1A. The double asterisks indicate statistical significance between the two tested samples (p≤0.05, N=4). All three drugs were used in combination to detect any possible additive or synergistic effect. Because any single drug alone did not alter the killing rates under the no chloride condition, the experiment with all three inhibitors in combination in the absence of chloride was omitted. Panel B: Lack of effect of the inhibitors on the rate of neutrophil phagocytosis. PsA bacteria were grown in a 14C-labeled amino acid mixture. The radioactive PsA were opsonized and fed to neutrophils under the indicated conditions. After removal of free bacteria as described in the Materials and Methods, neutrophil-retained radioactivity was determined by liquid scintillation counting. The data were obtained from 4 different donors. Vertical bars represent the SEM.
Figure 4
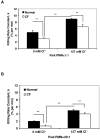
Figure 4. The rate of PsA killing by normal and CF neutrophils
Panel A: The rate of PsA killing as indicated by the first-order rate constant (% per min) by normal (Solid bars) and CF (Open bars) neutrophils in chloride-poor medium (0 mM chloride) or chloride-rich medium (127 mM chloride) at the ratio of 1-5:1 (PsA:PMN). Error bars represent SEM (N=5 donors each). Asterisks indicate p≤ 0.05 for comparisons of the indicated means by Student’s t-tests. Panel B: The rate of PsA killing as indicated by the first-order rate constant (% per min) by normal (Solid bars) and CF (Open bars) neutrophils in chloride-poor medium (0 mM Chloride) and chloride-rich medium (127 mM Chloride) at an MOI of 20:1 (PsA:PMN). Error bars represent SEM (N=5 donors each) and asterisks indicate p≤ 0.05 by Student’s t-tests.

Similar articles

Cited by

References

    1. Klebanoff SJ. Myeloperoxidase: friend and foe. J. Leukoc. Biol. 2005;77:598–625. - PubMed
    1. Ganz T, Lehrer RI. Defensins. Pharmacol Ther. 1995;66:191–205. - PubMed
    1. Hampton MB, Kettle AJ, Winterbourn CC. Inside the neutrophil phagosome: oxidants, myeloperoxidase, and bacterial killing. Blood. 1998;92:3007–17. - PubMed
    1. Sbarra AJ, Karnovsky ML. The biochemical basis of phagocytosis. I. Metabolic changes during the ingestion of particles by polymorphonuclear leukocytes. J Biol Chem. 1959;234(6):1355–62. - PubMed
    1. Hirsch JG, Cohn ZA. Degranulation of polymorphonuclear leucocytes following phagocytosis of microorganisms. J Exp Med. 1960;112:1005–14. - PMC - PubMed

Publication types

MeSH terms

Substances