. 2008 Mar 25;105(12):4844-9.
doi: 10.1073/pnas.0712251105. Epub 2008 Mar 19.

Cytosine methylation profiling of cancer cell lines

Affiliations

Cytosine methylation profiling of cancer cell lines

Mathias Ehrich et al. Proc Natl Acad Sci U S A. .

Abstract

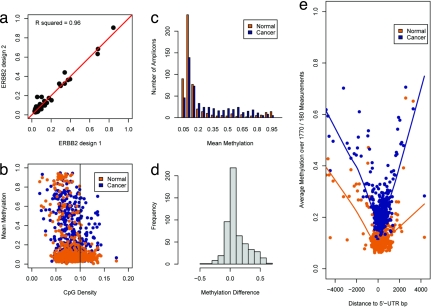
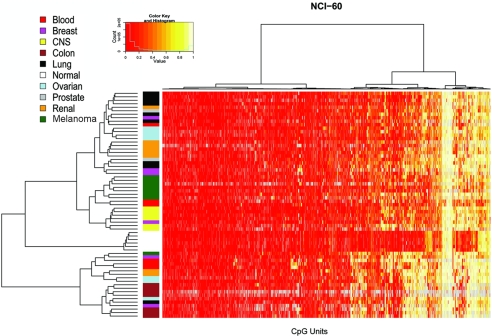
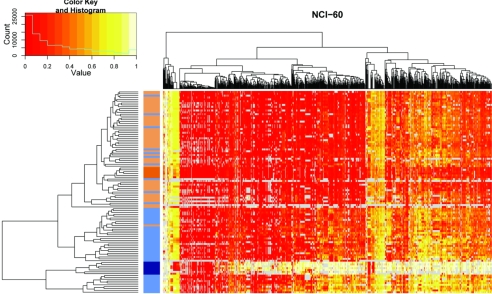
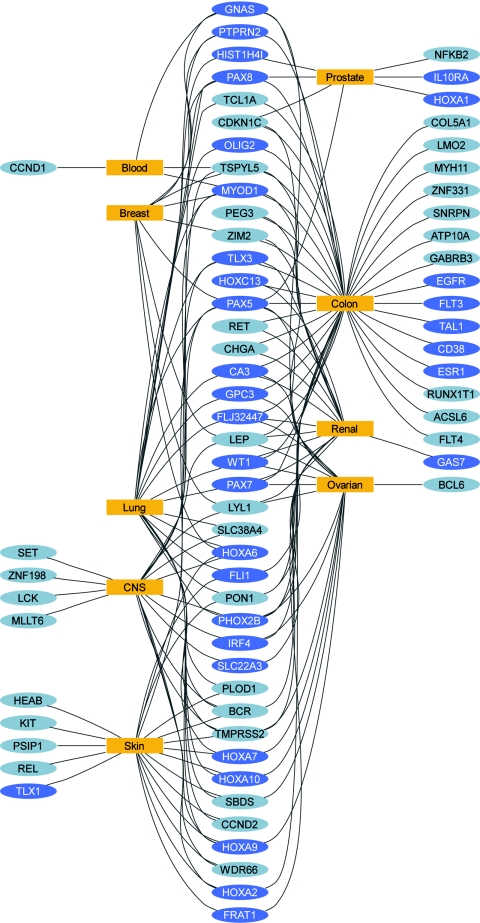
DNA-methylation changes in human cancer are complex and vary between the different types of cancer. Capturing this epigenetic variability in an atlas of DNA-methylation changes will be beneficial for basic research as well as translational medicine. Hypothesis-free approaches that interrogate methylation patterns genome-wide have already generated promising results. However, these methods are still limited by their quantitative accuracy and the number of CpG sites that can be assessed individually. Here, we use a unique approach to measure quantitative methylation patterns in a set of >400 candidate genes. In this high-resolution study, we employed a cell-line model consisting of 59 cancer cell lines provided by the National Cancer Institute and six healthy control tissues for discovery of methylation differences in cancer-related genes. To assess the effect of cell culturing, we validated the results from colon cancer cell lines by using clinical colon cancer specimens. Our results show that a large proportion of genes (78 of 400 genes) are epigenetically altered in cancer. Although most genes show methylation changes in only one tumor type (35 genes), we also found a set of genes that changed in many different forms of cancer (seven genes). This dataset can easily be expanded to develop a more comprehensive and ultimately complete map of quantitative methylation changes. Our methylation data also provide an ideal starting point for further translational research where the results can be combined with existing large-scale datasets to develop an approach that integrates epigenetic, transcriptional, and mutational findings.


Conflict of interest statement

Conflict of interest statement: M.E., J.T., C.C., and D.v.d.B. are shareholders and full-time employees of Sequenom, Inc.

Figures

Fig. 1.
Fig. 1.
Descriptive analysis of methylation data for normal and tumor cell-line samples. (a) A scatterplot depicts the results from a replicate analysis of ERBB2 by using two different primer designs. The quantitative measurements are highly concordant. (b) Relationship between CpG density and mean methylation levels in cancer and normal samples. CpG density of amplicons was calculated as the fraction of CpG nucleotides within the total amplicon sequence. The mean methylation value for each amplicon was generated by using all individual CpG sites' methylation values. Amplicons with >10% CpG content are likely to have lower methylation values in normal tissues. In cancer cell lines, DNA methylation is observed more frequently in these amplicons. (c) Amplicons were binned based on their average methylation values. Each bin contained amplicons within a 5% range of methylation values. Bins from 15% to 85% average methylation contain more amplicons in the set of cancer cell lines. (d) Histogram of methylation differences. For each amplicon, we calculated the difference in mean methylation between the group of normal samples and the group of tumor cell lines. Positive values translate to hypermethylation in cancer cell lines, whereas negative values indicate that the mean methylation was higher in the group of normal samples. The distribution of methylation differences is skewed toward hypermethylation. (e) DNA methylation in relation to the closest 5′ UTR. The distance from the 5′ UTR was calculated for every individual CpG site. Each data point contains 1,770 individual methylation values for the cancer cell lines and 180 values for the normal samples. It is necessary to adjust the number of data points in each group because of the difference in sample numbers in the two sets. A window of 1 kbp around the 5′ UTR shows low methylation values in the normal and the cancer cell-line samples. Methylation values in the cancer cell-line samples are generally elevated.
Fig. 2.
Fig. 2.
Two-way hierarchical cluster analysis of 59 tumor cell-line samples and 6 samples from normal tissues (rows) and DNA-methylation of CpG Units in 531 promoter regions (columns). DNA-methylation values are depicted in this false-color image on a continuous scale from red (nonmethylated) to yellow (100% methylated). Poor quality data are in gray. Samples are color-coded according to their cell-line tissue origin (legend, upper left) to simplify identification of potential sample clusters. Strong sample-cluster formation is observed for the group of normal samples, the group of colon cancer samples (brown), melanoma samples (green), and CNS tumors (yellow). Less-dominant clustering is observed in lung cancers (black), renal carcinoma (orange), and ovarian cancer (blue). The cell-line samples derived from breast cancer (pink), leukemia (red), and prostate cancer (gray) do not form obvious clusters. The normal samples are characterized by consistent low methylation levels. The cancer cell-line samples show more-variable methylation patterns. Sample annotations for the final branches of the tree are shown in SI Fig. 10.
Fig. 3.
Fig. 3.
Two-way hierarchical cluster analysis of 48 colon cancer samples, 48 adjacent normal colon tissue samples, 7 colon cancer cell lines, and 6 normal DNA samples (rows) and DNA-methylation of CpG Units in 64 promoter regions (columns). DNA-methylation values are depicted in this false-color image on a continuous scale from red (nonmethylated) to yellow (100% methylated). Poor quality data are annotated in gray. Samples are color-coded according to their origin (dark blue, colon cancer cell line; dark orange, normal control DNA; light blue, colon cancer tissue; light orange, normal colon tissue) to simplify identification of potential sample clusters. The hierarchical cluster algorithm separates colon cancer samples from normal tissue samples. Although they are clustered tightly together in a terminal branch of the dendrogram, all colon cancer cell lines are found among colon cancer tissue samples. The same applies to normal tissue samples within the group of normal colon tissue samples. Some (n = 10) colon cancer tissues are located in the group of normal tissue samples. Note that methylation differences for colon cancer cell lines tend to be higher than for colon cancer tissues.
Fig. 4.
Fig. 4.
This network diagram illustrates the relationship between significantly differentially methylated genes and the cell-line tumor types. Genes are shown as colored ellipses (yellow, PRC2 targets; gray, no PRC2 binding site) and cell-line types are shown as blue rectangles. A connection is shown between a cell-line tumor type and a gene when a statistically significant methylation difference was identified between the tumor type and the normal samples. Genes located on the outside are connected to a single tumor type. Genes located between tumor types are connected to at least two different tumor types. Most highly connected genes tend to be PRC2 targets, whereas genes connected to a single tumor type are less likely to be a target of PRC2. Fifty-eight percent of all genes connected to more than one tumor type are PCR2 targets, whereas only 30% of genes connected to a single tumor type are PRC2 targets.

References

    1. Laird PW. The power and the promise of DNA methylation markers. Nat Rev Cancer. 2003;3:253–266. - PubMed
    1. Rollins RA, et al. Large-scale structure of genomic methylation patterns. Genome Res. 2006;16:157–163. - PMC - PubMed
    1. Futreal PA, et al. A census of human cancer genes. Nat Rev Cancer. 2004;4:177–183. - PMC - PubMed
    1. Staunton JE, et al. Chemosensitivity prediction by transcriptional profiling. Proc Natl Acad Sci USA. 2001;98:10787–10792. - PMC - PubMed
    1. Wang H, et al. Comparative analysis and integrative classification of NCI60 cell lines and primary tumors using gene expression profiling data. BMC Genomics. 2006;7:166. - PMC - PubMed