. 2008 Mar 19;28(12):3017-29.
doi: 10.1523/JNEUROSCI.4761-07.2008.

Bounded integration in parietal cortex underlies decisions even when viewing duration is dictated by the environment

Affiliations

Bounded integration in parietal cortex underlies decisions even when viewing duration is dictated by the environment

Roozbeh Kiani et al. J Neurosci. .

Abstract

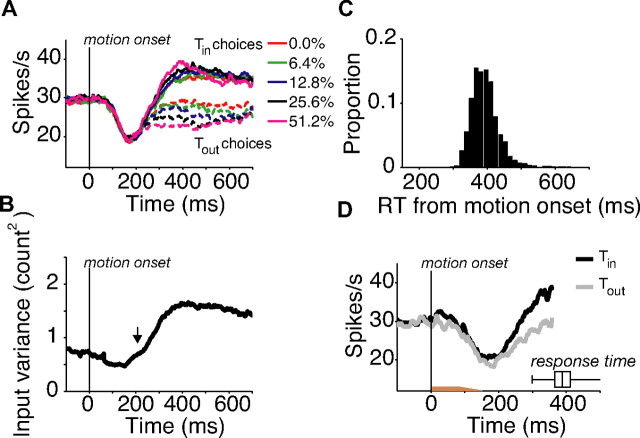
Decisions about sensory stimuli are often based on an accumulation of evidence in time. When subjects control stimulus duration, the decision terminates when the accumulated evidence reaches a criterion level. Under many natural circumstances and in many laboratory settings, the environment, rather than the subject, controls the stimulus duration. In these settings, it is generally assumed that subjects commit to a choice at the end of the stimulus stream. Indeed, failure to benefit from the full stream of information is interpreted as a sign of imperfect accumulation or memory leak. Contrary to these assumptions, we show that monkeys performing a direction discrimination task commit to a choice when the accumulated evidence reaches a threshold level (or bound), sometimes long before the end of stimulus. This bounded accumulation of evidence is reflected in the activity of neurons in the lateral intraparietal cortex. Thus, the readout of visual cortex embraces a termination rule to limit processing even when potentially useful information is available.


Figures

Figure 1.
Figure 1.
Direction discrimination task. After the monkey fixated, two choice targets appeared in the periphery. One of the targets (Tin) was within the RF of the neuron, indicated by the gray shading. The other target (Tout) was in the opposite hemifield. After a 250–600 ms delay period, dynamic random dots appeared within a 5° circular aperture centered on the fixation spot. The stimulus remained on for 80–1500 ms. Motion strength in each trial was selected randomly from a predefined set; the net direction was either toward Tin or Tout. The disappearance of the fixation spot (Go signal) instructed the monkey to execute a saccadic eye movement to one of the choice targets. The Go signal either coincided with termination of the motion stimulus (no-delay trials) or followed a 500–1000 ms delay period. A liquid reward was administered for choosing the target along the direction of motion and in half of the trials with no coherent motion. All trial types were randomly intermixed.
Figure 2.
Figure 2.
Time course of neural and behavioral responses. A, Average activity from 51 LIP neurons. The neural responses begin to convey information about motion direction and choice after ∼200 ms. B, The rise in neural response variance corresponds with accumulation of noisy evidence. The graph shows the input variance, the portion of variance that is not explained by the change in mean firing rate (see Materials and Methods). The arrow indicates when the input variance begins to increase reliably. C, Distribution of the monkey's RT from the motion onset for very short, no-delay trials (motion durations, 80–150 ms; mean, 100 ms). D, LIP responses to trials in C. The brown horizontal bar shows the range of motion durations. The box-and-whisker at lower right depicts the range of RTs for these trials. The central box shows the median and interquartile range.
Figure 3.
Figure 3.
Limited improvement in perceptual accuracy with longer motion viewing duration. A, Probability of correct response as a function of stimulus duration for the five motion strengths. The trials are divided into 20 quantiles based on stimulus duration (n ≈ 1024 trials per data point). B, Behavioral discrimination thresholds deviate from perfect accumulation for longer viewing duration. The discrimination thresholds were estimated by fitting cumulative Weibull function to the 20 columns of points in A. The threshold is motion strength supporting 81.6% correct choices. The red line shows the expected change of threshold for perfect accumulation of evidence. Error bars represent SE.
Figure 4.
Figure 4.
The effect of motion information on decisions diminishes at longer viewing times. A, Spatiotemporal filters used in the motion energy calculation. The filters in the left and right columns are selective for opposite directions of motion. The two filters in each column form a quadrature pair. Application of the filters permits extraction of the motion energy as a function of time in each trial. B, Average motion energy for the 0% coherence trials with durations longer than 700 ms (n = 1811). Positive and negative values indicate rightward and leftward motion, respectively. The shaded region indicates SEM. C, Expected separation of motion energy profiles for rightward (red) and leftward (blue) choices for a simulated bounded accumulator (top) and a simulated leaky accumulator (bottom). In trials with long durations, leaky accumulation would render information at the beginning of the trial irrelevant, whereas bounded accumulation would render information at the end of the trial irrelevant. D, Separation of motion energy profiles for the monkeys' rightward and leftward choices (same trials as in B).
Figure 5.
Figure 5.
Late motion pulses do not bias the monkey's behavior, whereas early pulses do. In each trial, a weak motion pulse (3.2% coherence to the right or left) was introduced at a random time. The range of stimulus durations was 280–1500 ms to accommodate these pulses. A, The probability of choosing the rightward target is plotted as a function of motion strength for all trials with rightward (black) and leftward (gray) motion pulses. Positive and negative coherences correspond to rightward and leftward motions, respectively. The motion pulses significantly biased the monkey's choice toward their corresponding target. This bias is quantified by the horizontal separation of the two functions, here equivalent to 1.3 ± 0.1% coherent motion. B–F, Effect of pulse time on pulse effectiveness. Trials with long stimulus duration (>700 ms) were divided into four groups of equal size (quartiles) based on the pulse time. For each group, a pair of psychometric functions was constructed for the two pulse directions (C–F). The horizontal separation is plotted as a function of pulse time in B (error bars are SE of the shifts). The motion pulses caused a significant shift in the psychometric functions for the earlier two quartiles (C, D), but not for the later quartiles (E, F). The plots in C–F focus on the middle of the coherence range to allow better visualization of the effect of the weak motion pulses.
Figure 6.
Figure 6.
Time course of LIP activity for Tin choices in short- and long-RT trials. For each cell and coherence level, the trials were divided into two groups based on the median RT. The neural activity was averaged across coherences and cells. A, No-delay trials with short motion duration (<200 ms). B, Delay trials with short motion duration (<200 ms). C, No-delay trials with longer motion duration (>700 ms).
Figure 7.
Figure 7.
Correlation between saccadic response times and the neural bound crossing time (Tbc). Tbc for each trial is the time when the firing rate first exceeded a threshold specified by the sustained level of activity of the cell in the delay period (see Materials and Methods). A, Relationship between RT and Tbc for 0% coherence trials with short durations (<200 ms) and no delay period. Each point represents one trial. The confidence ellipse is stretched 1.5 × SD along the principle components of the data points. B, Pearson's correlation coefficient of RT and Tbc for the five motion strengths. Error bars represent the 95% confidence interval. C, D, Same as A and B for trials with a 500–1000 ms delay between the end of stimulus and the Go signal (same range of stimulus durations as in A and B).
Figure 8.
Figure 8.
Error responses are governed by the same mechanism as the correct responses. A, Average activity of the LIP neurons in correct and error trials. Neural responses were averaged across all stimulus durations and nonzero motion strengths. B, Correlation between RT and Tbc in error trials with short stimulus durations and no delay period. Error bars represent the 95% confidence interval. The number of errors was small at the higher motion strengths (e.g., n = 52 for 25.6% coherence), hence the larger confidence interval.

Similar articles

Cited by

References

    1. Adelson EH, Bergen JR. Spatiotemporal energy models for the perception of motion. J Opt Soc Am A. 1985;2:284–299. - PubMed
    1. Bair W, Cavanaugh JR, Smith MA, Movshon JA. The timing of response onset and offset in macaque visual neurons. J Neurosci. 2002;22:3189–3205. - PMC - PubMed
    1. Bogacz R. Optimal decision network with distributed representation. Neural Netw. 2007;20:564–576. - PubMed
    1. Bracewell RM, Mazzoni P, Barash S, Andersen RA. Motor intention activity in the macaque's lateral intraparietal area. II. Changes of motor plan. J Neurophysiol. 1996;76:1457–1464. - PubMed
    1. Britten KH, Shadlen MN, Newsome WT, Movshon JA. The analysis of visual motion: a comparison of neuronal and psychophysical performance. J Neurosci. 1992;12:4745–4765. - PMC - PubMed

Publication types

LinkOut - more resources