. 2008 Mar 19;28(12):3090-102.
doi: 10.1523/JNEUROSCI.5266-07.2008.

Structural correlates of efficient GABAergic transmission in the basal ganglia-thalamus pathway

Affiliations

Structural correlates of efficient GABAergic transmission in the basal ganglia-thalamus pathway

Agnes L Bodor et al. J Neurosci. .

Abstract

Giant inhibitory terminals with multiple synapses, the counterparts of excitatory "detonator" or "driver" terminals, have not been described in the forebrain. Using three-dimensional reconstructions of electron microscopic images, we quantitatively characterize a GABAergic pathway that establishes synaptic contacts exclusively via multiple synapses. Axon terminals of the nigrothalamic pathway formed, on average, 8.5 synapses on large-diameter dendrites and somata of relay cells in the ventromedial nucleus of the rat thalamus. All synapses of a given terminal converged on a single postsynaptic element. The vast majority of the synapses established by a single terminal were not separated by astrocytic processes. Nigrothalamic terminals in the macaque monkey showed the same ultrastructural features both in qualitative and quantitative terms (the median number of synapse per target was also 8.5). The individual synapses were closely spaced in both species. The nearest-neighbor synaptic distances were 169 nm in the rat and 178 nm in the monkey. The average number of synapses within 0.75 microm from any given synapse was 3.8 in the rat and 3.5 in the monkey. The arrangement of synapses described in this study creates favorable conditions for intersynaptic spillover of GABA among the multiple synapses of a single bouton, which can result in larger charge transfer. This could explain faithful and efficient GABAergic signal transmission in the nigrothalamic pathway in the healthy condition and during Parkinson's disease. In addition, our structural data suggest that the rodent nigrothalamic pathway can be a valid model of the primate condition, when the mechanism of GABAergic transmission is studied.


Figures

Figure 1.
Figure 1.
Topography of nigrothalamic terminals and their relationship to calbindin immunostaining in the rat. A, Schematic labeling of five injection sites in the SNR shown at five coronal levels of the atlas of Paxinos and Watson (1998). B–G, Distribution of the dense core of nigrothalamic terminal fields in the thalamus, color coded according to the labeling in A. Scattered fibers are omitted for clarity. The outlines of the terminal fields are shown overlaid on calbindin-immunostained coronal sections of the thalamus sampled 300 μm apart. Note the dual terminal fields in the ventromedial and intralaminar nuclei and the long anteroposterior extent of the terminal fields. Caudal SNR injections result in more dense intralaminar fiber plexuses, whereas rostral injections label only few fibers in these nuclei. H, I, Light microscopic images of the VM double stained for BDA (black) and calbindin (brown) after injection of the tracer into SNR. The boxed area in H is shown enlarged in I. Nigrothalamic terminals (arrows in I) are restricted to the zone containing calbindin-immunoreactive cells (asterisks). J, Nigrothalamic terminals establish multiple contacts (arrows) on the soma of a calbindin-positive relay cell. I and J are multifocal images. Scale bars: B–G, 1 mm; H, 200 μm; I, 50 μm; J, 10 μm. AV, Anteroventral thalamic nucleus (n.); CL, centrolateral thalamic n.; F, nucleus of the fields of Forel; fr, fasciculus retroflexus; Hb, habenular n.; LD, laterodorsal thalamic n.; LH, lateral hypothalamic area; LP, lateral posterior thalamic n.; MD, mediodorsal thalamic n.; ml, medial lemniscus; mt, mammillothalamic tract; PaR, pararubral nucleus; PC, paracentral thalamic n.; PR, prerubral field; Po, posterior thalamic n. group; RMC, red nucleus, magnocellular part; RPC, red nucleus, parvicellular part; sm, stria medullaris of thalamus; SNC, substantia nigra, compact part; Sub, submedius thalamic n.; VA, ventral anterior thalamic n.; VL, ventrolateral thalamic n.; VTA, ventral tegmental area; ZID, zona incerta dorsal part; ZIV, zona incerta ventral part.
Figure 2.
Figure 2.
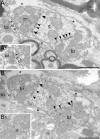
Ultrastructural features of nigrothalamic terminals in the VM of rat. High-power electron microscopic images. Neighboring sections of two anterogradely labeled nigrothalamic boutons (b) in the VM are shown. A1, B1, Silver-intensified gold particles (thin arrows) indicate the anterograde tracer. A2, B2, Small black particles are the results of postembedding GABA immunostaining. Note that in A2 and B2, the anterograde signal is absent because of the etching procedure of the postembedding GABA immunostaining. Both nigrothalamic terminals establish multiple symmetrical synapses (arrows) and puncta adherentia (arrowheads) with their postsynaptic targets [proximal dendrite (d) in A; soma (s) in B]. Note that vesicles are present outside the clusters of mitochondria. The outer surfaces of the terminals are covered by glial sheets (asterisk). Glia can intrude into the synapse-bearing surface (A1, A2, triangles) or into the terminal (B1, B2, diamonds). Scale bars, 0.5 μm.
Figure 3.
Figure 3.
Target selectivity and synapse size of the rat nigrothalamic terminals. A, Bar graph showing the minor diameter of randomly selected dendrites and the target dendrites of nigrothalamic terminals in the VM using 0.2 μm bin width. The distribution of the diameter of random dendrites is shown in two ways, as bars representing the percentage of dendrites in each bin (similar to the target dendrites; left y-axis) but also as a continuous line showing the summated perimeter of the dendrites in each bin (right y-axis). The first one is used for statistical comparison, whereas the second one better represents the available target surfaces. Note that the distribution of the target diameters is skewed toward the larger values compared with random sample. B, Whisker plot showing the size distribution of nigrothalamic synapses in the VM. max, Maximum; min, minimum.
Figure 4.
Figure 4.
3D reconstructions of nigrothalamic terminals in rats. A1, A2, Two views of the same terminal. Yellow, Synapses; blue, PA; red, membrane of the terminal; green, glia. All synapses are located on the same side of the terminal and contact the same postsynaptic target (not shown). A glial process intrudes into the synapse-bearing surface (asterisks), but no glia is apparent among the majority of the synapses. A3, A synapse (S4 arrow) is established on a dendritic appendage of the target dendrite, which protrudes into the terminal. Thin arrow, Silver-intensified gold particle indicating the tracer. A4, 3D reconstruction of the dendritic appendage (orange). A5–A8, Synapses (S1–S3 arrows) between the two black lines in A2 are shown in serial electron microscopic sections. Sections shown in A5–A7 were postembedding immunoreacted for GABA. Arrowheads indicate PA. A1–B4, Two views of the outer surface (B1–B3; same color coding as above) and the inner organelles (B2–B4; blue, vesicle pool; dark green, mitochodria) of another nigrothalamic terminal. Note the rim of synapses around the central meshwork of PA in B1 and the corresponding distribution of the vesicle pool in B2. No glial intrusion is present on the synapse-bearing face, whereas glia covers the rest of the terminal. Scale bars: A1, A2, A4, B1–B4, 1 μm; A3, A5–A8, 0.5 μm.
Figure 5.
Figure 5.
Distribution of vGLUT2 immunostaining in the motor thalamus of the macaque monkey. A–F, The gray area shows thalamic regions containing large vGLUT2-immunoreactive terminals on the schemes modified from the atlas of Paxinos et al. (2000), which depict the outlines of the three large, nonoverlapping regions of the motor thalamus: cerebellar-recipient (cb), nigro-recipient (nigr), and pallido-recipient (pal). The panels are in a coronal plane in rostral (A) to caudal (F) order. Note the general correspondence between the vGLUT2-immunoreactive regions (gray) and the cb areas. A significant discrepancy is visible only in the dorsolateral part in C and D. Note the vGLUT2-positive islands in B and C, which is in line with cerebellar tracing studies. The gray arrowhead in A points to the region reembedded for electron microscopic analysis. Black arrowheads in A and F indicate the positions of light microscopic images shown in G and H, respectively. G, H, High-power, multifocal light microscopic images of vGLUT2 immunostaining in the nigro-recipient (G) and cerebello-recipient (H) thalamus. Large vGLUT2-positive terminals are entirely absent in nigrorecipient territories, whereas they are abundant in the cerebellar zone (arrows). Scale bars: A–F, 2 mm; G, H, 50 μm. mt, Mammillothalamic tract; AV, anteroventral thalamic nucleus; ZI, zona incerta; Rt, reticular thalamic nucleus; iml, internal medullary lamina; VAL, ventral anterior thalamic nucleus, lateral part; VAM, ventral anterior thalamic nucleus, medial part; VL, ventrolateral thalamic nucleus.
Figure 6.
Figure 6.
Electron microscopic images of two large GABAergic boutons showing the ultrastructural features of nigrothalamic terminals in monkey. High-power electron microscopic images of two axon terminals (b1, b2) converging on the same large-caliber dendrite in the nigro-recipient part of the macaque thalamus are shown. The neighboring section (B) is immunoreacted for GABA. The ultrastructure of the terminals is identical to nigrothalamic terminals described previously in single sections (Kultas-Ilinsky and Ilinsky, 1990) (i.e., large-size, numerous mitochondria; several PA; multiple synapses; thick-caliber postsynaptic target; flat vesicles). Besides the main relay cell target, terminal b1 also establishes a synapse (A, A1, white arrowheads) on a thin dendritic process (id) identified as an interneuron dendrite on the GABA-immunostained section (B1). This dendrite also receives an asymmetrical synapse (A1, thin arrow) from a non-GABAergic terminal (b3). Glial sheets around the terminal are labeled with asterisks. A 3D reconstruction of bouton b1 is shown in Figure 7B. Scale bar, 0.5 μm. Black arrow indicates synapse; arrowhead indicates PA.
Figure 7.
Figure 7.
3D reconstructions of large GABAergic boutons showing the ultrastructural features of nigrothalamic terminals in monkey. Two terminals are shown. Color coding is as in Figure 4. A1, A2, Two views of the same GABAergic terminals. All synapses contacting the relay cell dendrite (not shown) are located on the same side of the terminal. Note the centrally located network of PA and the laterally placed synapses, similar to the arrangement found in rat nigrothalamic terminals (Fig. 4). B1, B2, Two views of another terminal (b1 terminal on Fig. 6). In this case, besides the eight synapses (B1, yellow) contacting a relay cell dendrite, the opposite side of the terminal establishes two other synapses (IS1, IS2; one of them is shown in Fig. 6, A and A1) on an interneuron dendrite. 3D reconstruction of the terminal in A is shown in supplemental movie 2 (available at www.jneurosci.org as supplemental material). Scale bars, 1 μm.
Figure 8.
Figure 8.
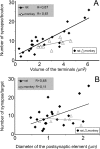
Correlation between the number of synapses, the size of the terminals, and the diameter of the postsynaptic target in the two species. A, Correlation between the volume of the terminals and the number of synapses per bouton. B, Correlation between the diameter of the postsynaptic elements (excluding somatic targets) and the number of synapses with a given target. Rat data, Black diamonds; monkey data, gray triangles. Lines represent the linear regression for each dataset. The data points are in the same range in both species, but only the bouton size and the number of synapses show correlation in case of rats.
Figure 9.
Figure 9.
Analysis of the intersynaptic distances in rat and monkey. A, Whisker plot of all intersynaptic distances of four reconstructed monkey and rat terminals. B, Bar graph showing the same data set as A using 0.2 μm bin width. C, The average number of neighboring synapses with increasing distances from any given synapse. D, Cumulative plot of the nearest-neighbor synaptic distances as the percentage of the total number of nearest-neighbor synaptic distances. Note the closely matched datasets of the two species in C and D.

Similar articles

Cited by

References

    1. Asanuma C, Thach WT, Jones EG. Distribution of cerebellar terminations and their relation to other afferent terminations in the ventral lateral thalamic region of the monkey. Brain Res. 1983;286:237–265. - PubMed
    1. Baimbridge KG, Miller JJ. Immunohistochemical localization of calcium-binding protein in the cerebellum, hippocampal formation and olfactory bulb of the rat. Brain Res. 1982;245:223–229. - PubMed
    1. Bar-Gad I, Morris G, Bergman H. Information processing, dimensionality reduction and reinforcement learning in the basal ganglia. Prog Neurobiol. 2003;71:439–473. - PubMed
    1. Bartho P, Freund TF, Acsády L. Selective GABAergic innervation of thalamic nuclei from zona incerta. Eur J Neurosci. 2002;16:999–1014. - PubMed
    1. Bartho P, Slézia A, Varga V, Bokor H, Pinault D, Buzsaki G, Acsády L. Cortical control of zona incerta. J Neurosci. 2007;27:1670–1681. - PMC - PubMed

Publication types

MeSH terms

Substances

LinkOut - more resources