. 2008 Mar 19;28(12):3131-40.
doi: 10.1523/JNEUROSCI.5460-07.2008.

Nonlinear integration of binocular optic flow by DNOVS2, a descending neuron of the fly

Affiliations

Nonlinear integration of binocular optic flow by DNOVS2, a descending neuron of the fly

Adrian Wertz et al. J Neurosci. .

Abstract

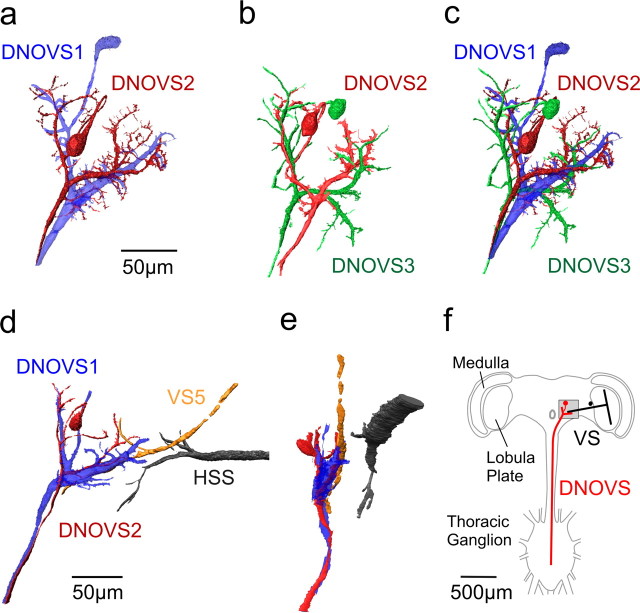
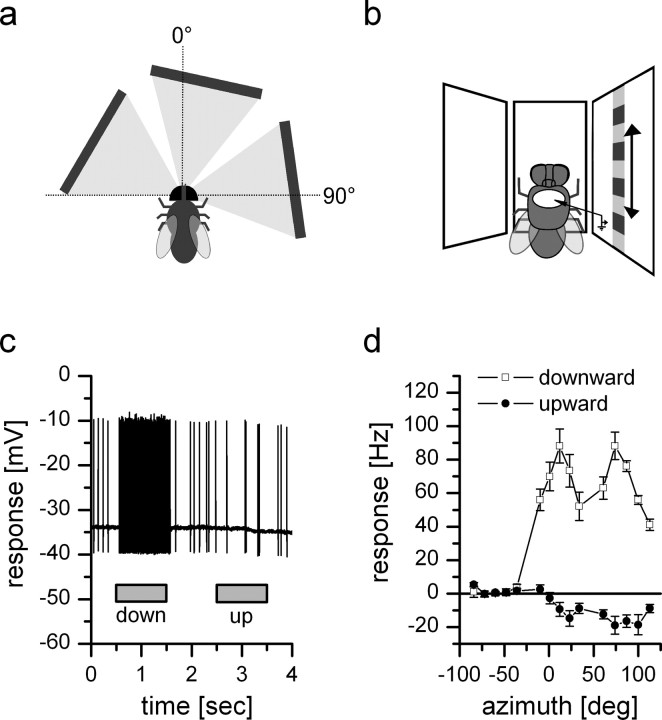
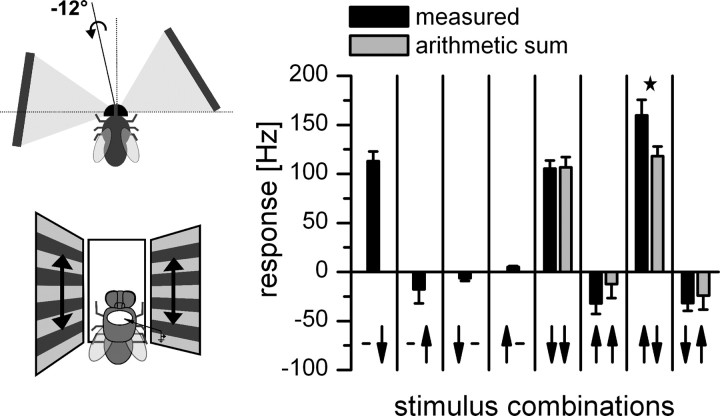
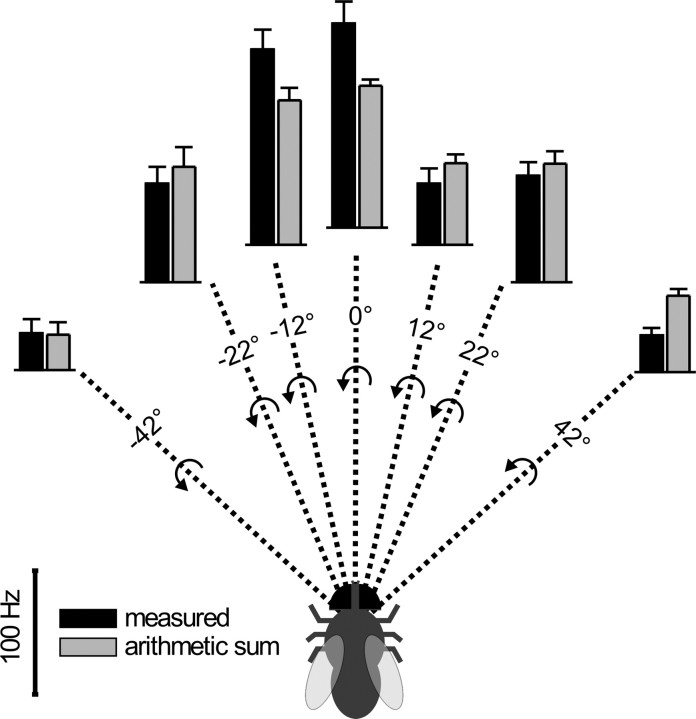
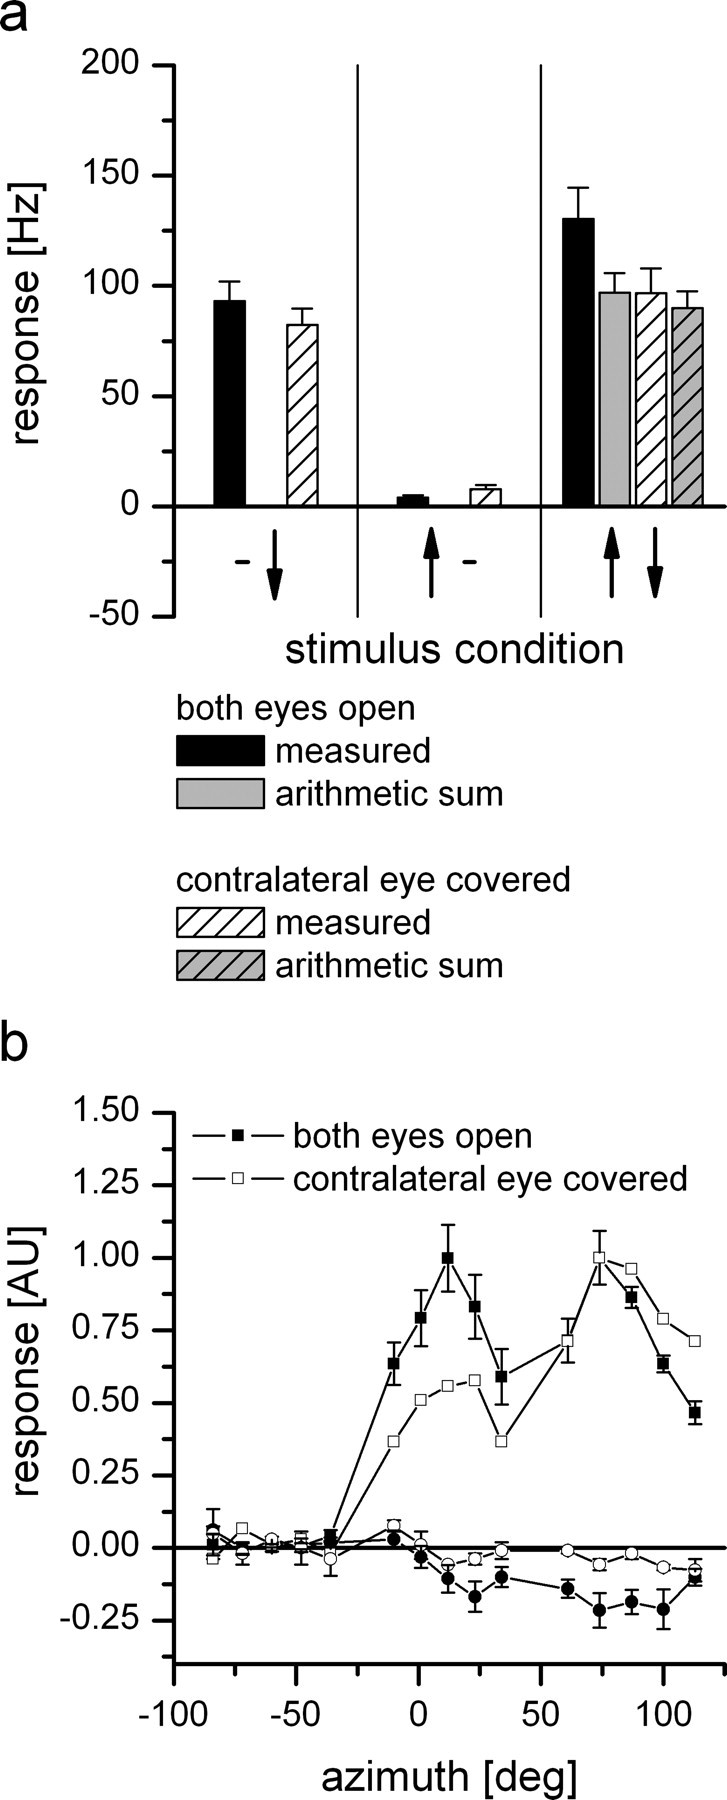
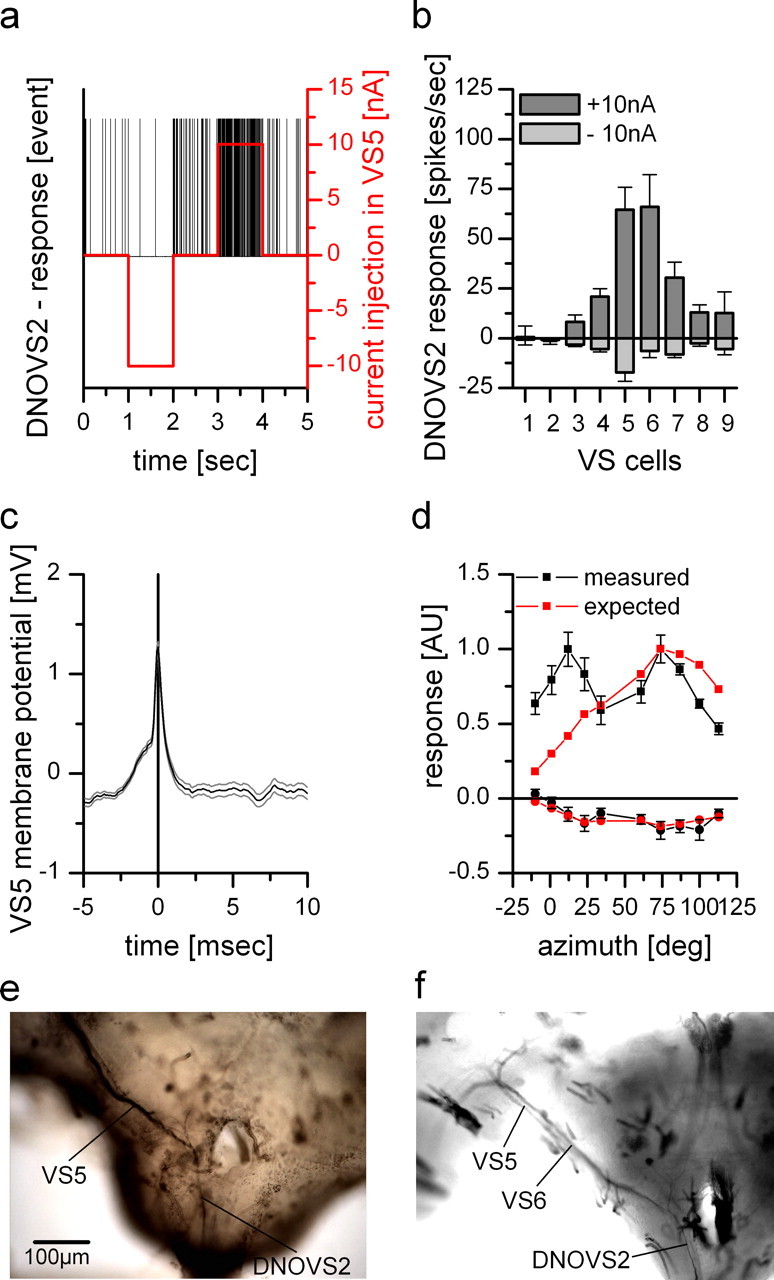
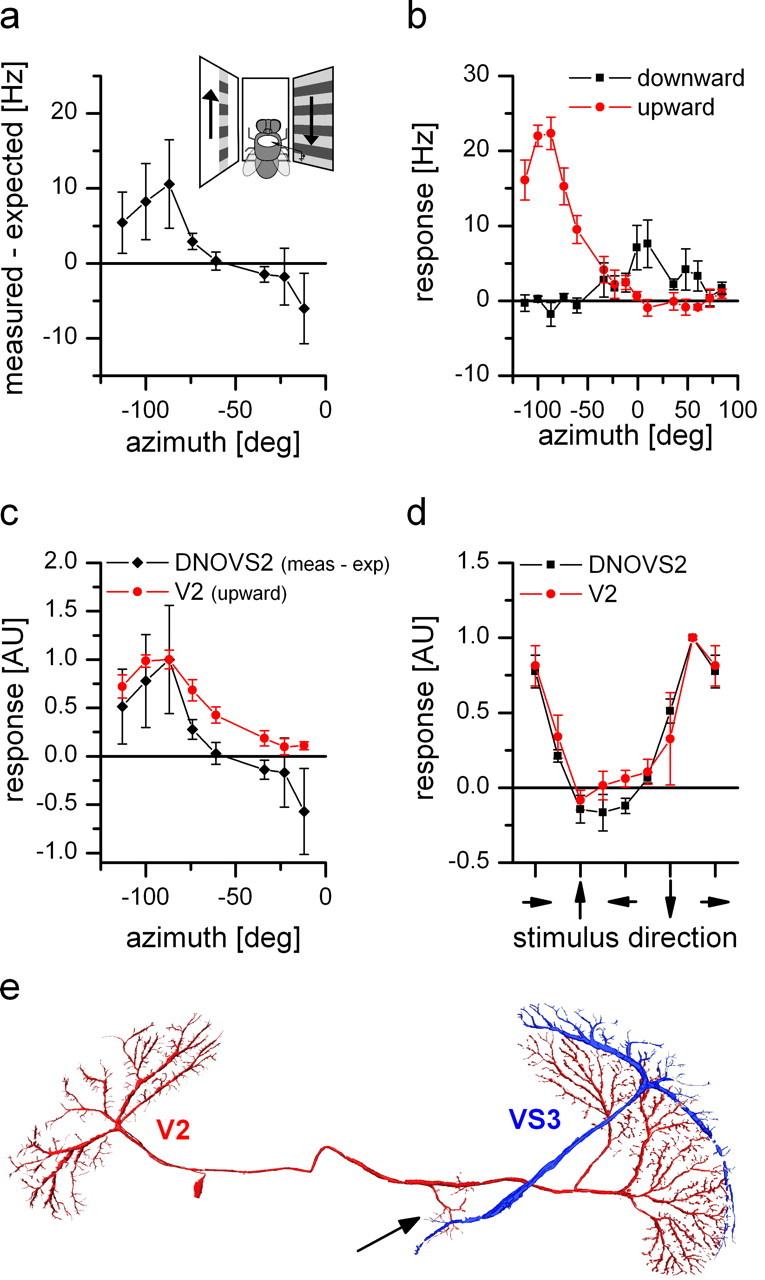
For visual orientation and course stabilization, flies rely heavily on the optic flow perceived by the animal during flight. The processing of optic flow is performed in motion-sensitive tangential cells of the lobula plate, which are well described with respect to their visual response properties and the connectivity among them. However, little is known about the postsynaptic descending neurons, which convey motion information to the motor circuits in the thoracic ganglion. Here we investigate the physiology and connectivity of an identified premotor descending neuron, called DNOVS2 (for descending neuron of the ocellar and vertical system). We find that DNOVS2 is tuned in a supralinear way to rotation around the longitudinal body axis. Experiments involving stimulation of the ipsilateral and the contralateral eye indicate that ipsilateral computation of motion information is modified nonlinearly by motion information from the contralateral eye. Performing double recordings of DNOVS2 and lobula plate tangential cells, we find that DNOVS2 is connected ipsilaterally to a subset of vertical-sensitive cells. From the contralateral eye, DNOVS2 receives input most likely from V2, a heterolateral spiking neuron. This specific neural circuit is sufficient for the tuning of DNOVS2, making it probably an important element in optomotor roll movements of the head and body around the fly's longitudinal axis.


Figures

Figure 1.
Figure 1.
Anatomy of DNOVS cells. a, Two-photon imaging of DNOVS1 and DNOVS2. DNOVS1 (blue) was filled with Alexa 568, and DNOVS2 (red) was filled with Alexa 488. b, Two-photon imaging of DNOVS2 and DNOVS3. DNOVS2 (red) was filled with Alexa 568, and DNOVS3 (green) was filled with Alexa 488. c, Reconstruction of all three DNOVS cells. The reconstructions in a and b were superimposed according to the position of DNOVS2. In contrast to DNOVS1, DNOVS2 and DNOVS3 bifurcate in their lateral dendritic branch with numerous short processes. d, x–y projection of DNOVS1 (blue), DNOVS2 (red), VS5 (yellow), and HSS (black). e, Same as in d, but in a y–z projection. The side view shows that the terminal of VS5 and the dendrites of the DNOVS cells are in close vicinity, whereas the terminal of the HSS cell lies in different depth. Cells within two-photon image stacks were reconstructed with the AMIRA software package (see Material and Methods). F, Schematic drawing of the fly nervous system showing VS cells within the lobula plate of the fly brain and the DNOVS cells postsynaptically projecting from the brain in the thoracic ganglion. Image stacks from a–e were taken in the highlighted region.
Figure 2.
Figure 2.
Intracellular recording from DNOVS2. Top view (a) and frontal schematic drawing (b) of the stimulus situation. c, Example response of DNOVS2 to full field downward and upward motion in all three monitors. The cell responds to downward motion with an increase of the spike frequency and to upward motion with a slight decrease of the spike frequency. d, Response of DNOVS2 to vertical motion as a function of the azimuth position. The highest responses to vertical motion are elicited at two positions of the azimuth: at a frontal position (10°) and a lateral position (75°) with downward motion increasing the spike rate and upward motion decreasing the spike rate. The mean firing rate at rest is 5–15 Hz and is increased by 88 Hz at the positions with highest response. In between, the response is less with a local minimum at 35° and an increase of the firing rate by 55 Hz. Data represent the mean ± SEM recorded from n = 7 flies.
Figure 3.
Figure 3.
Response of DNOVS2 to simultaneous motion in two sectors of the receptive field. The schematic drawings are indicating the stimulus situation. Black columns show the measured response to simultaneous motion in the ipsilateral and contralateral monitor, and gray columns indicate the algebraic sum of the responses to individual stimuli. The arrows on the x-axis represent the visual stimulus combination. The left arrow represents contralateral motion, and the right arrow represents ipsilateral motion. The arrowhead indicates the direction of motion. The neuron responds best to a rotation-like stimulus consisting of upward motion in the contralateral and downward motion in the ipsilateral field of view (penultimate stimulus configuration) with an axis of rotation at −12° (indicated in the first drawing). The response to this rotational-like stimulus is stronger than the response to downward motion in both monitors (fifth stimulus situation). This indicates that DNOVS2 responds to a rotational flow field stronger than to a translational one. In addition, for the rotational-like stimulus, the measured response is significantly higher than the arithmetic sum of the responses to individual stimuli (★ indicates p < 0.05, Wilcoxon signed-rank test). Data represent the mean ± SEM from n = 7 flies.
Figure 4.
Figure 4.
Tuning of DNOVS2 to a rotation-like optic flow around a longitudinal body axis. The responses of DNOVS2 to clockwise rotational-like optic flow at seven different monitor positions, each representing a different axis of rotation, is shown. This results in seven different axis of rotation, with angular separations from the midline: −42°, −22°, −12°, 0°, 12°, 22°, and 42°. Clockwise rotation around a longitudinal axis (0°) elicited the strongest response in DNOVS2. The measured response is significantly stronger than the arithmetic sum of the individual components. In contrast, the response to a rotation around an axis at 42° to the right is significantly less than the expected one. The clockwise, rotatory stimulus corresponds to a counterclockwise rotation as egomotion (indicated by the arrows). Data represent the mean ± SEM from n number of flies for each axis as follows: −42° (n = 4); −22° (n = 3); −12° (n = 7); 0° (n = 3); 12° (n = 3); 22° (n = 4); and 42° (n = 8).
Figure 5.
Figure 5.
Influence of the contralateral eye on DNOVS2. With the contralateral eye covered, the responses of DNOVS2 to simultaneous motion in two sectors of the visual field (a) and to vertical motion as a function of the azimuth position (b) were measured. The patterns in the graphs refer to the response of the neurons in the following condition: black, both eyes open; white striped, left eye covered; gray, arithmetic sum of the individual stimuli with both eyes open; gray striped, arithmetic sum of the individual stimuli with the left eye closed. a, Stimulus presentation in the ipsilateral and contralateral field of view. For the individual stimuli (ipsilateral is downward and contralateral is upward motion), the responses of DNOVS2 with both eyes open and contralateral eye covered are similar. For the combined stimulus (third stimulus situation), the measured response with the contralateral eye covered (white-striped column) is less than the measured response with both eyes open (black column) but as strong as the arithmetic sum of the individual components. Data for both eyes open are the same as in Figure 3, and data for the contralateral eye covered represent the mean ± SEM from n = 3 flies. b, Response of DNOVS2 to vertical motion as a function of the azimuth position. The responses differ in the frontal field of view, in which the response for downward motion with contralateral eye covered (open symbols) is less than the response with both eyes open (filled symbols). Data for the filled symbols are the same as in Figure 2, and data for the open symbols are from n = 1 fly. AU, Arbitrary units.
Figure 6.
Figure 6.
Dual recordings and dye coupling between DNOVS2 and VS cells. a, Current injection of −10 and +10 nA into VS5 led to a decrease and an increase of the spike frequency of DNOVS2, respectively. b, Current injection of −10 nA (light gray columns) and +10 nA (dark gray columns) in different VS cells elicited different levels of spike frequency decrease and increase of DNOVS2, respectively. Whereas DNOVS2 showed no responses to current injection into VS1 and VS2, it responds when current was injected into VS3–VS9. The strongest response was found for current injection into VS5 and VS6. Data represent the mean ± SEM of VS1 (n = 2), VS2 (n = 4), VS3 (n = 4), VS4 (n = 3), VS5 (n = 5), VS6 (n = 3), VS7 (n = 4), VS8 (n = 4), and VS9 (n = 2). c, Spike-triggered average of the membrane potential of a VS5 cell. A spike elicited in DNOVS2 (time point = 0) leads to a slight depolarization of the membrane potential of VS5. This spike-induced membrane shift indicates an electrical coupling between VS5 and DNOVS2. Data represent the mean ± SEM of a double recording with n = 1000 detected spike repetitions. d, Expected response of DNOVS2 (red) to vertical motion as a function of the azimuth calculated by the average response of VS1–VS9 to this stimulation (data from Haag et al., 2007) weighted by their connection strength to DNOVS2 as determined by current injection in b. The measured (black) and expected (red) response of DNOVS2 differ in the frontal field of view, in which the expected response does not show the frontal peak to downward motion. Data for the measured response are the same as in Figure 1. AU, Arbitrary units. e, Neurobiotin staining of VS5. Besides the costaining of adjacent VS cells, DNOVS2 (or DNOVS3) was found to be labeled, too (data from Haag and Borst, 2005). f, Injection of Neurobiotin into DNOVS2 led to a retrograde staining of VS6 and a weaker stained VS5 cell.
Figure 7.
Figure 7.
Response properties and anatomy of V2. a, Nonlinear summation of DNOVS2 as a function of the azimuth (black line). The difference between the measured response and the arithmetic sum of DNOVS2 for ipsilateral downward and contralateral upward motion is calculated for different azimuth positions. The contralateral stimulus was presented in 12° wide stripes at different position along the azimuth. At more lateral positions, the measured response of DNOVS2 is higher than the arithmetic sum, which indicates a supralinear integration. In contrast, for more frontal positions, the response of the cell is less than the arithmetic sum, indicating a sublinear integration. The highest nonlinearity was elicited at azimuth position of −87°. Data represent the mean value recorded from n = 2 flies. b, Response of V2 to vertical motion as a function of the azimuth position. The highest responses to vertical motion is elicited at lateral stimulus positions at approximately −87° in which upward motion increased the firing rate of the cell. In addition, V2 responds to motion in the frontal part with an inversed preferred direction. Data represent the mean value recorded extracellularly from n = 5 flies. Error bars represent the SEM. c, Overlay of the normalized sensitivity of V2 for upward motion (red) and the normalized nonlinearity profile of DNOVS2 (black) along the azimuth. The curves have a similar shape with a peak at the same azimuth position. AU, Arbitrary units. d, Orientation tuning of V2 (red) and DNOVS2 (black) in the frontal part of the visual field. The response normalized to the maximum response as a function of the stimulus direction is shown. The tuning curves of DNOVS2 and V2 are almost identical with a response maximum for oblique motion down to the right. Data represent the mean ± SEM of V2 (n = 4; extracellular), DNOVS2 (n = 3; 1 × intracellular + 2 × extracellular). e, Anatomy of V2. V2 and VS3 cells were filled intracellularly with the fluorescent dye Alexa 488 or Alexa 568, respectively. V2 is a heterolateral neuron projecting from one lobula plate to the other with en passant collateral to the terminal region of VS cells (arrow).

Similar articles

Cited by

References

    1. Beersma DGM, Stavenga DG, Kuiper JW. Retinal lattice, visual field and binocularities in flies. J Comp Physiol A Neuroethol Sens Neural Behav Physiol. 1977;119:207–220.
    1. Borst A. Fly visual interneurons responsive to image expansion. Zool Jb Physiol. 1991;95:305–313.
    1. Borst A, Bahde S. Spatio-temporal integration of motion: a simple strategy for safe landing in flies. Naturwissenschaften. 1988;75:265–267.
    1. Borst A, Egelhaaf M. In vivo imaging of calcium accumulation in fly interneurons as elicited by visual motion stimulation. Proc Natl Acad Sci USA. 1992;89:4139–4143. - PMC - PubMed
    1. Borst A, Haag J. Neural networks in the cockpit of the fly. J Comp Physiol A Neuroethol Sens Neural Behav Physiol. 2002;188:419–437. - PubMed

Publication types

LinkOut - more resources