. 2008 Mar 19;28(12):3178-89.
doi: 10.1523/JNEUROSCI.5259-07.2008.

Design of a neuronal array

Affiliations

Design of a neuronal array

Bart G Borghuis et al. J Neurosci. .

Abstract

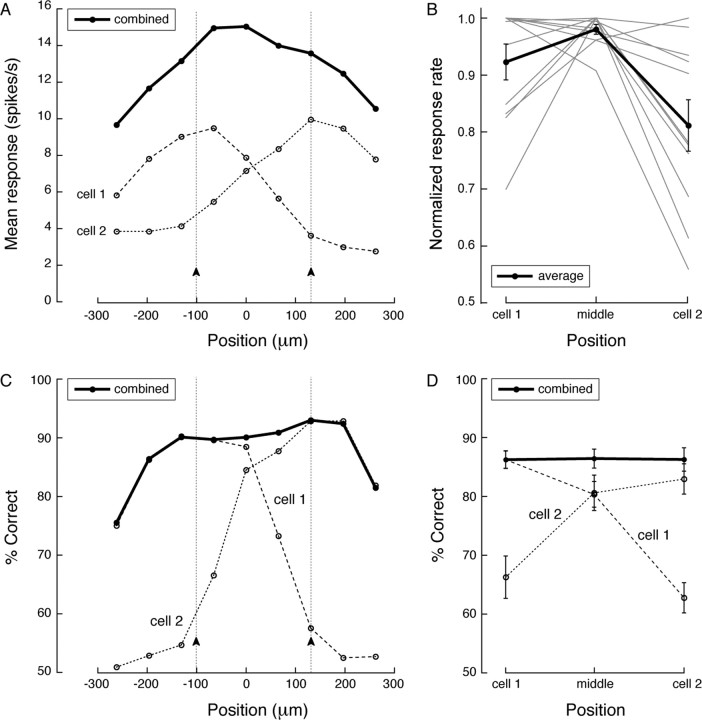
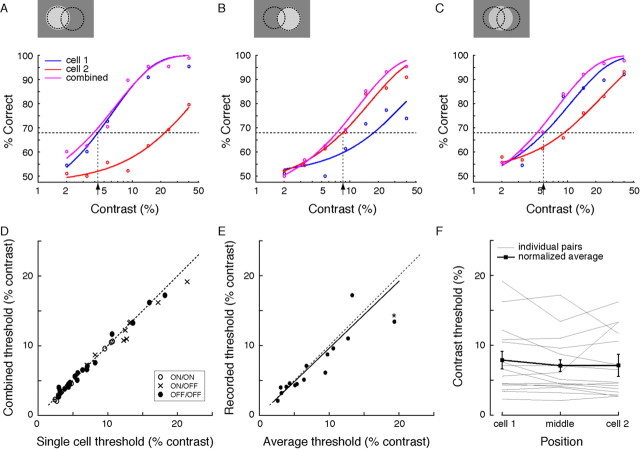
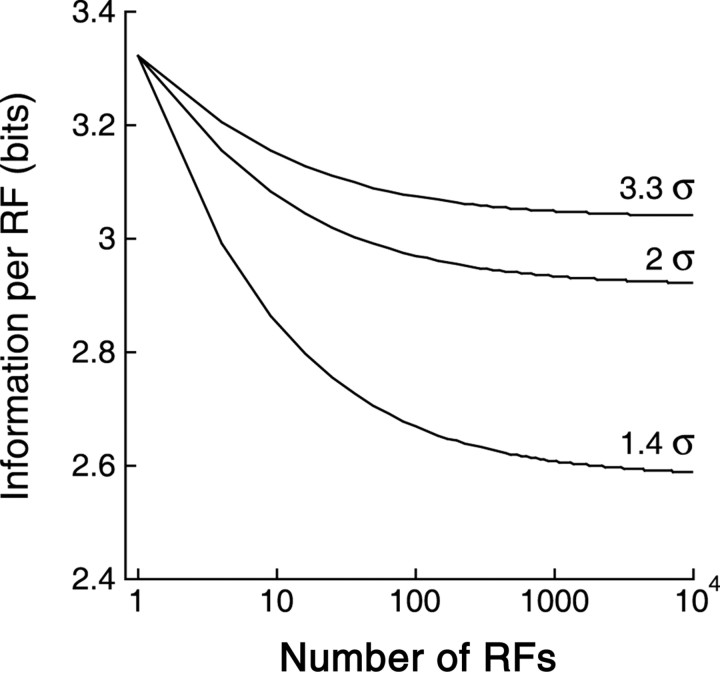
Retinal ganglion cells of a given type overlap their dendritic fields such that every point in space is covered by three to four cells. We investigated what function is served by such extensive overlap. Recording from pairs of ON or OFF brisk-transient ganglion cells at photopic intensities, we confirmed that this overlap causes the Gaussian receptive field centers to be spaced at approximately 2 SDs (sigma). This, together with response nonlinearities and variability, was just sufficient to provide an ideal observer with uniform contrast sensitivity across the retina for both threshold and suprathreshold stimuli. We hypothesized that overlap might maximize the information represented from natural images, thereby optimizing retinal performance for many tasks. Indeed, tested with natural images (which contain statistical correlations), a model ganglion cell array maximized information represented in its population responses with approximately 2sigma spacing, i.e., the overlap observed in the retina. Yet, tested with white noise (which lacks statistical correlations), an array maximized its information by minimizing overlap. In both cases, optimal overlap balanced greater signal-to-noise ratio (from larger receptive fields) against greater redundancy (because of larger receptive field overlap). Thus, dendritic overlap improves vision by taking optimal advantage of the statistical correlations of natural scenes.


Figures

Figure 1.
Figure 1.
Computing information represented in a ganglion cell array. A, We constructed a model whose inputs were images of natural scenes. Each pixel was represented by a cone with SNR estimated from the literature (see Materials and Methods). Postsynaptic to the cone, SNR was reduced to account for the reported loss of contrast sensitivity in the bipolar cell and ganglion cell (see Materials and Methods). The resulting cone signals were integrated with a difference-of-Gaussians weighting function with center and surround parameters obtained from real cells, which gave a spatial receptive field for each ganglion cell in the array (shown here for 2 cells). The integrated cone signal was mapped nonlinearly onto the dynamic response range of the ganglion cell (see Materials and Methods). We then computed, for a range of receptive field center separations, information represented by the array. B, In images of natural scenes, luminance correlations persisted across space, but contrast correlations decayed sharply. Correlations between luminance responses [responses of receptive field (RF) centers] persisted at large separations (circles; plotted here in units of σ). Correlations between contrast responses (responses of receptive field center − a balanced surround) vanished at ∼4σ (triangles). Luminance and contrast responses were independent at any separation (squares). Here σ = 12 image pixels.
Figure 2.
Figure 2.
Dendritic fields and receptive field centers of brisk-transient ganglion cells overlap. A, Dendritic fields of an OFF/OFF pair typically overlapped by ∼40%. To compute overlap, we measured the dendritic field area of each cell from a polygon drawn around the dendritic tips of a cell. We then divided the shared dendritic field area by the average dendritic field area of the two cells. B, For each recorded pair, temporal filter characteristics (left; spike-triggered average of the white-noise response) were strongly similar. Spatial response profiles (right) fitted with difference-of-Gaussians functions (RMSE, 0.080 ± 0.01; mean ± SEM; n = 52) show that neighboring ganglion cell receptive fields overlap substantially. The example cell spacings shown here, 2.1σ (ON/ON) and 1.7σ (OFF/OFF), are representative for our sample and correspond, respectively, to receptive field coverage factors of 4.1 and 6.1.
Figure 3.
Figure 3.
Simulation predicts that 2σ receptive field center spacing gives a spatially invariant sensory surface. A, The average array sensitivity (linear sum of single cell receptive fields at each location, Sa) at 2σ spacing equals the peak sensitivity of a single cell (peak height of receptive field, Ss). Simulated difference-of-Gaussians receptive fields (black lines) show that array sensitivity (gray line) decreases with wider spacing. Receptive field parameters were obtained from spatiotemporal white-noise recordings; results shown for ON cells, OFF cell parameters gave similar results. B, At ∼2σ spacing, average array sensitivity approximates peak sensitivity of a single cell. For spacing >2σ, sensitivity dips between receptive field centers and the sensitivity surface becomes bumpy. C, The Fourier transform of the sensitivity surface of the array shows that flatness breaks abruptly for receptive field spacing exceeding 2σ. y-Axis shows modulation amplitude at the fundamental frequency divided by the mean.
Figure 4.
Figure 4.
Simultaneous recordings from neighboring ganglion cells confirm that contrast sensitivity is spatially invariant. A spot was presented at nine locations along a line through the receptive field centers of a brisk-transient ON/ON ganglion cell pair. A, At suprathreshold contrast (3.2%), the firing rate of a cell increased when the spot was presented closer to its receptive field center (average rate during the 500 ms trial). The sum of the firing rates of the cells varied with spot position and peaked for a spot midway between the two cells. B, This was true for all recorded pairs. C, An ideal observer detected the spot based on the response of either cell, or both. When the spot was located near a receptive field center (arrows), detection performance for single and combined responses was the same. For locations between cells, detection based on the response of a single cell was worse than for a spot presented over the receptive field center of the cell. However, when the responses of the two cells were combined, ideal observer detection of a spot between receptive fields was the same as for a spot presented to the receptive field center of either cell. D, This was observed for all pairs: combining responses of neighboring cells, percentage correct detection is the same at each spot position.
Figure 5.
Figure 5.
Single-cell threshold for contrast detection does not improve by adding the response of a neighbor. Recording from a ganglion cell pair, a spot of optimal size was presented over the center or midway between either cell. An ideal observer detected the spot based on the response of either cell alone, or combined. The task of the ideal observer was to detect nonzero contrast in a single-interval, two-alternative, forced-choice paradigm. A, B, Graphs show detection performance as the percentage correct choices on the basis of the response of cell 1, cell 2, or both. The dotted line represents detection threshold, set at 68% correct. For a spot centered on one cell, contrast detection was not improved by including the response of the other cell. C, For a spot midway between the two cells, both contribute to detection, but threshold is similar to that for a spot centered on either cell. D–F, Combined contrast thresholds are as low as the best single-cell threshold and constant over space. D, Contrast threshold based on the best single-cell response was the same as that based on the combined responses of neighbors. E, Moreover, the average of the thresholds of the two cells for a centered spot and the recorded threshold for a spot located between them differed by <5% (solid line; linear fit, slope 0.96). Data point marked with * represents an ON/OFF pair with unusually high overlap (for details, see Results). F, Combined contrast threshold was the same for spots centered on and between cells. Thick line shows mean ± 1 SD.
Figure 6.
Figure 6.
Simulated contributions of all neighbors do not improve contrast detection. A, For a centered spot at threshold (∼4% contrast; OFF/OFF pair), a neighbor fires <2 spikes/s, which suggests minimal redundancy. B, We recorded responses from pairs of neighboring ganglion cells (filled circles) with a spot centered on one cell. Contrast threshold, computed with an ideal observer, does not improve when the responses of the center cell (inset, solid line) and a single neighbor (inset, dotted line) are combined (mean ± 1 SD). We simulated additional neighbors (inset, dotted lines) from the response of the recorded neighbor (see Results). For all recorded pairs (n = 15), adding up to six neighbors did not significantly lower the threshold for contrast detection (t test, p = 0.13). In a control simulation, combining successive responses from the center cell improved detection in accordance with the square root law (open circles).
Figure 7.
Figure 7.
Information about natural scenes is maximized for model arrays when receptive fields are spaced at approximately twice the SD of the central Gaussian (2σ). A, We measured information represented by a receptive field array stimulated with natural images. Left inset, Small patch of natural image with overlaid array. Right inset, Small patch of white noise with an overlaid array. B, Information represented from natural images peaks at a receptive field (RF) spacing of ∼2σ. Bars show the average measured spacing ± 1 SD for the ON and OFF arrays (ON, n = 8, light bar; OFF, n = 12, dark bar). Tested with synthetic natural images (natural pink noise; see Results), represented information peaks at the same receptive field spacing as for natural scenes. Information represented from white-noise images increases monotonically, but gradually, with center spacing in units of σ. Hence, the optimal array for white noise has large spacing, effectively minimizing receptive field overlap. C, Optimal spacing is robust to changes in receptive field surround width: a twofold increase in the surround width would leave optimal spacing within the measured range (ON, light bar; OFF, dark bar). Surround widths much larger (≫2-fold) than the measured width would lead to widely spaced optimal arrays (>3 s) with contrast sensitivity surfaces that are not flat (compare Fig. 3A,C; see Discussion). D, Optimal spacing is also robust to changes in the cone SNR estimate: over four orders of magnitude of the SNR, optimal array spacing remains within the measured range.
Figure 8.
Figure 8.
Information per receptive field asymptotes to a constant for large arrays. Given a fixed number of response levels (SNR), the asymptotic value is lower for arrays with greater overlap (smaller spacing in terms of σ; spacings of 3.3σ, 2σ, and 1.4σ shown). This reflects redundancy in responses of overlapping receptive fields. Here, contrasts were quantized to 10 levels, matching the dynamic range and variability of ganglion cell responses reported in the literature (see Appendix).

References

    1. Adelson EH. Saturation and adaptation in the rod system. Vision Res. 1982;22:1299–1312. - PubMed
    1. Atick JJ, Redlich AN. Towards a theory of early visual processing. Neural Comput. 1990;2:308–320.
    1. Atick JJ, Li Z, Redlich AN. Understanding retinal color coding from first principles. Neural Comput. 1992;4:559–572.
    1. Attwell D, Laughlin SB. An energy budget for signaling in the grey matter of the brain. J Cereb Blood Flow Metab. 2001;21:1133–1145. - PubMed
    1. Balasubramanian V, Kimber D, Berry MJ., II Metabolically efficient information processing. Neural Comput. 2001;13:799–815. - PubMed

Publication types

LinkOut - more resources