. 1991 Aug;33(4):471-91.
doi: 10.1177/001872089103300408.

Comprehension of synthetic speech produced by rule: word monitoring and sentence-by-sentence listening times

Affiliations

Comprehension of synthetic speech produced by rule: word monitoring and sentence-by-sentence listening times

J V Ralston et al. Hum Factors. 1991 Aug.

Abstract

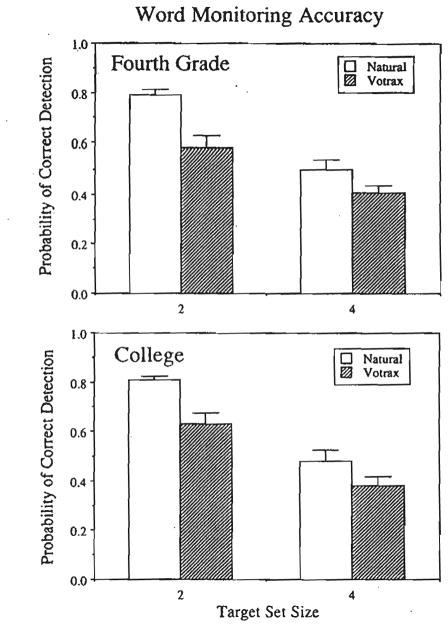
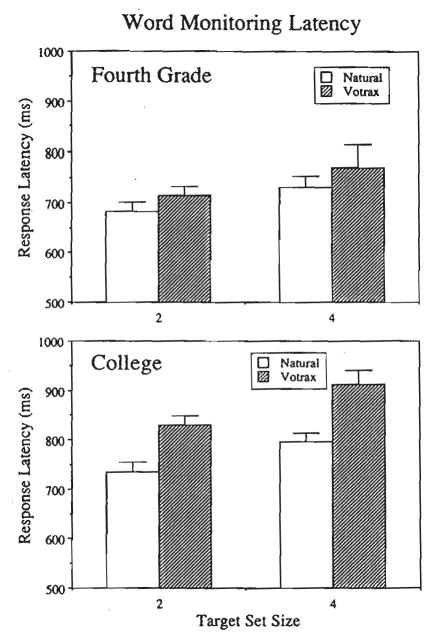
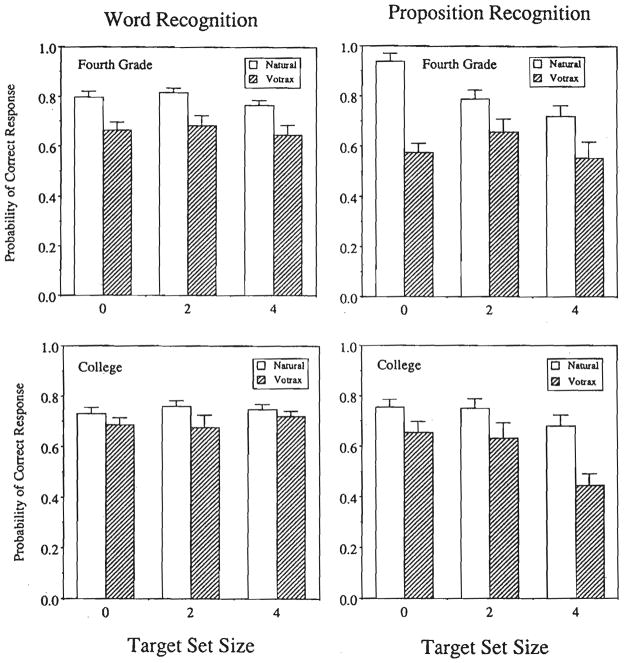
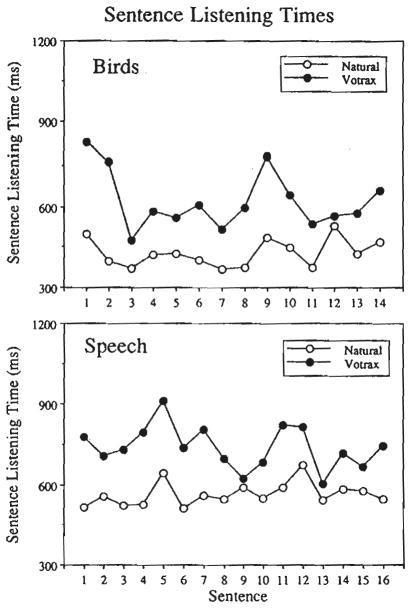
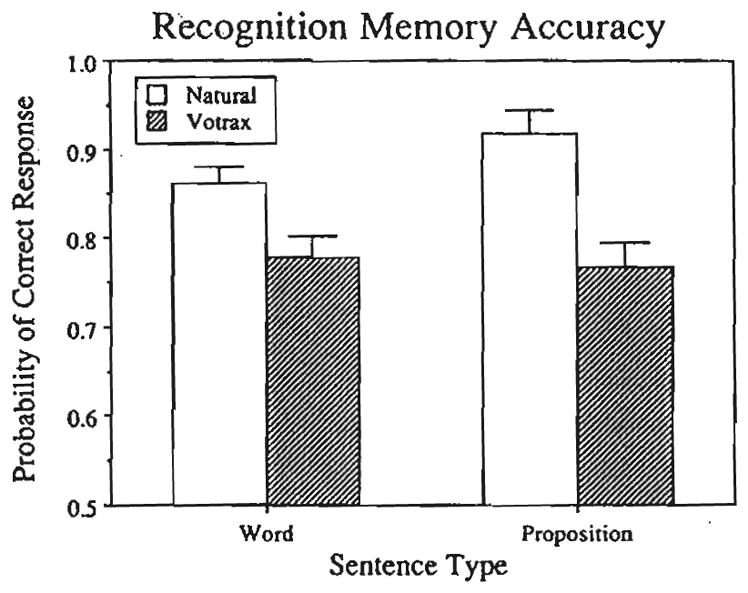
Previous comprehension studies using postperceptual memory tests have often reported negligible differences in performance between natural speech and several kinds of synthetic speech produced by rule, despite large differences in segmental intelligibility. The present experiments investigated the comprehension of natural and synthetic speech using two different on-line tasks: word monitoring and sentence-by-sentence listening. On-line task performance was slower and less accurate for passages of synthetic speech than for passages of natural speech. Recognition memory performance in both experiments was less accurate following passages of synthetic speech than of natural speech. Monitoring performance, sentence listening times, and recognition memory accuracy all showed moderate correlations with intelligibility scores obtained using the Modified Rhyme Test. The results suggest that poorer comprehension of passages of synthetic speech is attributable in part to the greater encoding demands of synthetic speech. In contrast to earlier studies, the present results demonstrate that on-line tasks can be used to measure differences in comprehension performance between natural and synthetic speech.


Figures

Figure 1
Figure 1
Word-monitoring accuracy (probability of a correct detection) as a function of target-set size in Experiment 1. The upper panel shows data for fourth-grade passages, and the lower panel shows data for college-level passages. Open bars represent accuracy for passages of natural speech, and striped bars represent accuracy for passages of Votrax synthetic speech. Error bars represent one standard error of the sample means.
Figure 2
Figure 2
Word-monitoring response latency (in milliseconds) as a function of target-set size in Experiment 1. The upper panel shows data for fourth-grade passages, the lower panel for college-level passages. Open bars represent latencies for passages of natural speech, and striped bars represent latencies for passages of Votrax synthetic speech. Error bars represent one standard error of the sample means.
Figure 3
Figure 3
Recognition memory accuracy (probability correct) as a function of target-set size in Experiment 1. The panels on the left show data for word recognition sentences, and the panels on the right show data for proposition recognition sentences. The upper panels show data for fourth-grade passages, the lower panels for college-level passages. Open bars represent accuracy for sentences after passages of natural speech, striped bars for sentences after passages of synthetic speech. Error bars represent one standard error of the sample means.
Figure 4
Figure 4
Sentence-by-sentence listening times as a function of voice and text difficulty in Experiment 2. Open bars represent response latencies for passages of natural speech, and striped bars represent response latencies for passages of synthetic speech. Error bars represent one standard error of the sample means.
Figure 5
Figure 5
Sentence-by-sentence listening times as a function of voice in Experiment 2. The panels on the left display response latencies for the five fourth-grade passages; panels on the right display response latencies for the five college-level passages. Open bars represent response latencies for passages of natural speech, and striped bars represent response latencies for passages of synthetic speech. Error bars represent one standard error of the sample means.
Figure 6
Figure 6
Sentence-by-sentence listening times as a function of the position of a sentence within a passage in Experiment 2. The upper panel displays data for a representative fourth-grade passage, the lower panel for a representative college-level passage. Open circles and connecting lines represent response latencies for passages of natural speech. Solid circles and connecting lines represent response latencies for passages of synthetic speech.
Figure 7
Figure 7
Recognition memory accuracy (probability correct) as a function of text difficulty in Experiment 2. The upper panel shows data for word recognition sentences, the lower panel for proposition recognition sentences. Open bars represent accuracy for sentences after passages of natural speech, and striped bars represent accuracy for sentences after passages of synthetic speech. Error bars represent one standard error of the sample means.
Figure 8
Figure 8
Recognition memory accuracy (probability correct) as a function of sentence type in Experiment 2. Open bars represent accuracy for sentences after passages of natural speech, striped bars for sentences after passages of synthetic speech. Error bars represent one standard error of the sample means.

Similar articles

Cited by

References

    1. Allen J, Klatt DH, Hunnicutt S. From text to speech: The MITalk system. Cambridge, England: Cambridge University Press; 1987.
    1. Bartlett FC. Remembering. Cambridge, England: Cambridge University Press; 1932.
    1. Blank MA, Pisoni DB, McClaskey CL. Effects of target monitoring on understanding fluent speech. Perception and Psychophysics. 1981;29:383–388. - PMC - PubMed
    1. Britton BK, Westbrook RD, Holdredge T. Reading and cognitive capacity: Effects of text difficulty. Journal of Experimental Psychology: Human Learning and Memory. 1978;4:582–591.
    1. Brunner H, Pisoni DB. Some effects of perceptual load on spoken text comprehension. Journal of Verbal Learning and Verbal Behavior. 1982;21:186–195. - PMC - PubMed

Publication types

LinkOut - more resources