Review
. 2008 Aug;90(8):1149-71.
doi: 10.1016/j.biochi.2008.02.020. Epub 2008 Feb 29.

Structures, folding patterns, and functions of intramolecular DNA G-quadruplexes found in eukaryotic promoter regions

Affiliations
Review

Structures, folding patterns, and functions of intramolecular DNA G-quadruplexes found in eukaryotic promoter regions

Yong Qin et al. Biochimie. 2008 Aug.

Abstract

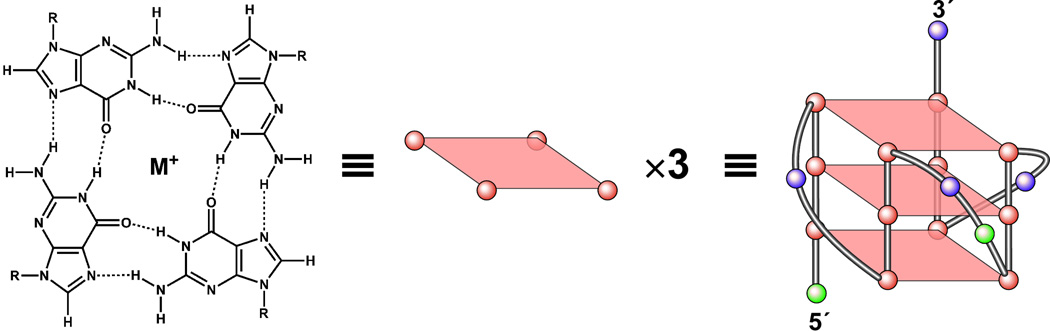
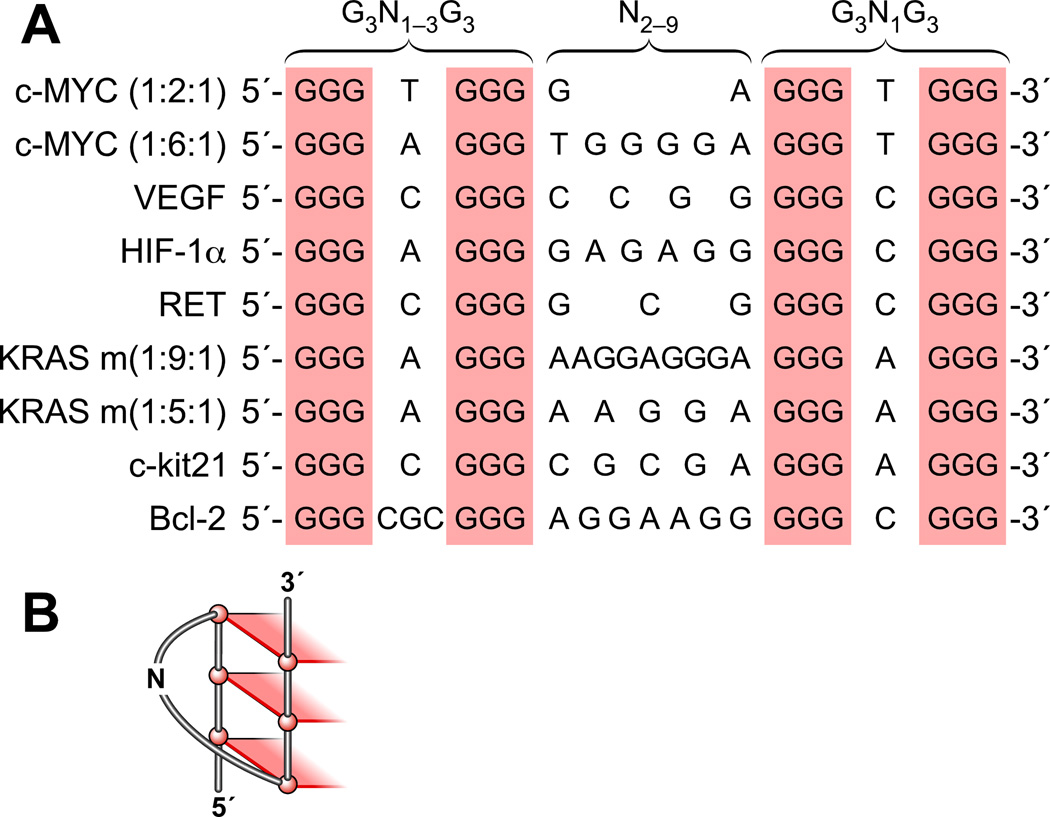
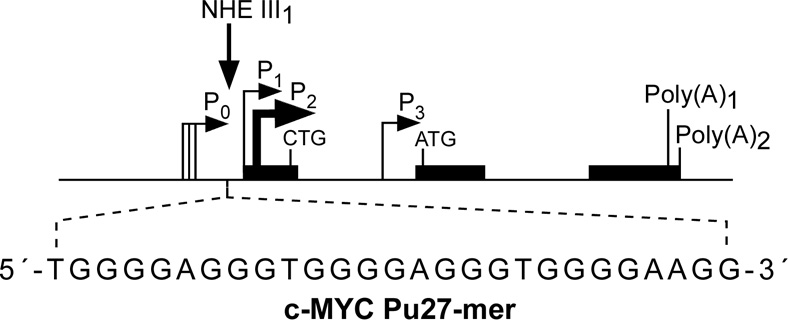
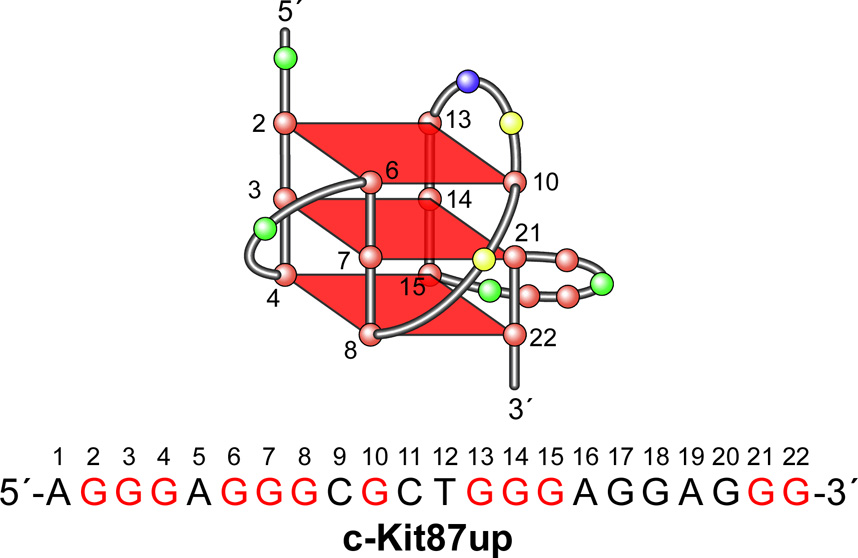
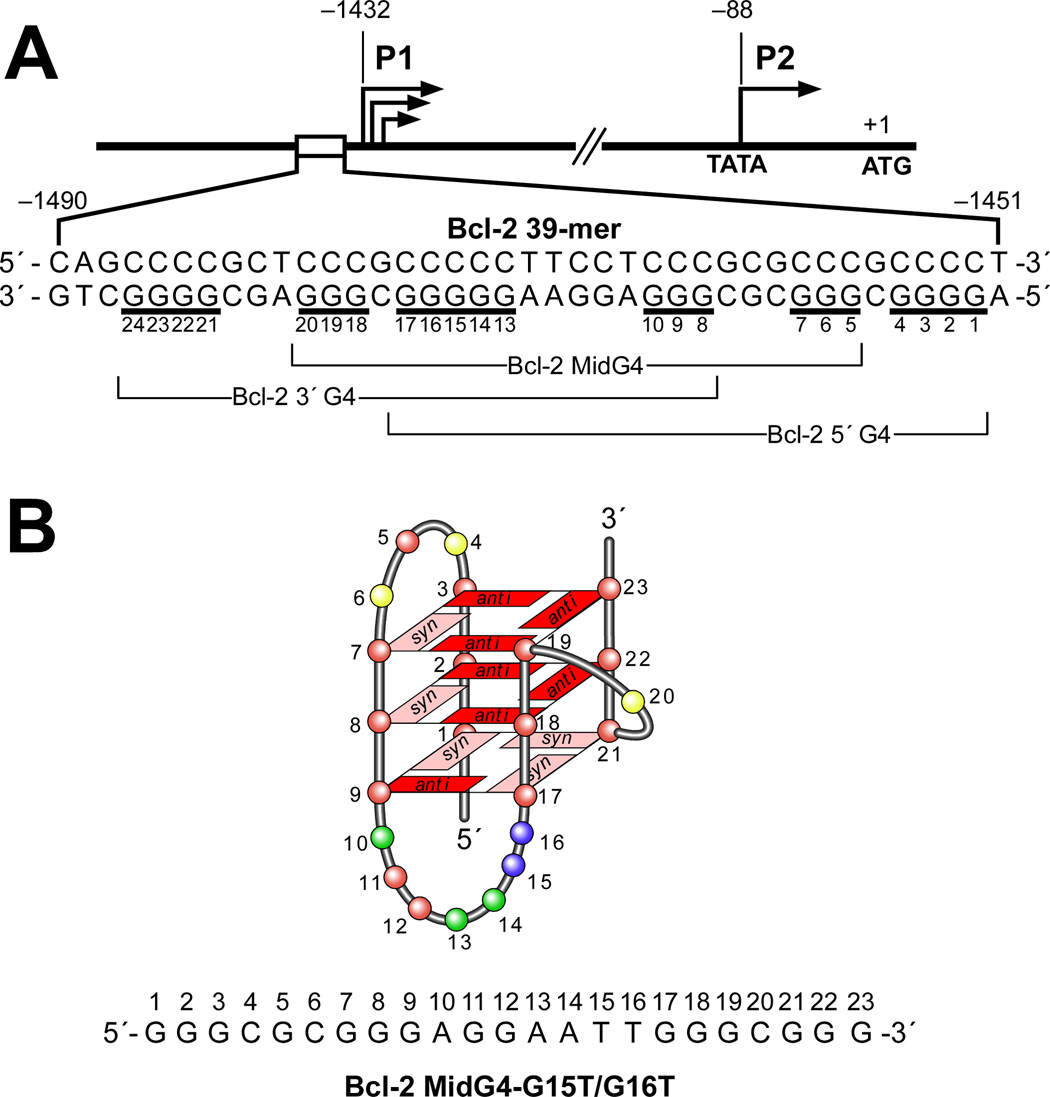
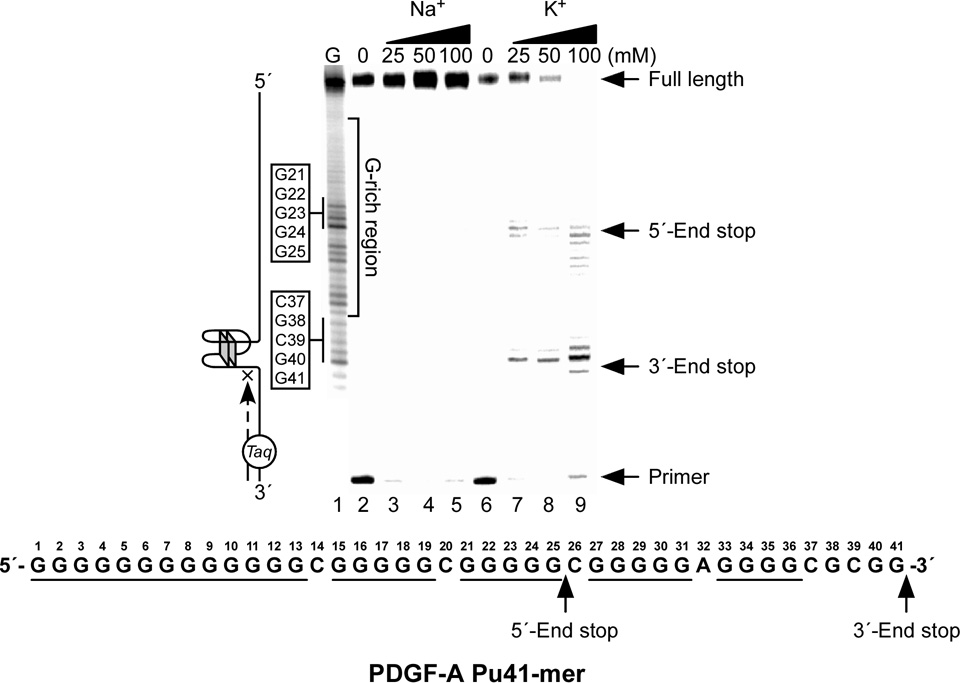
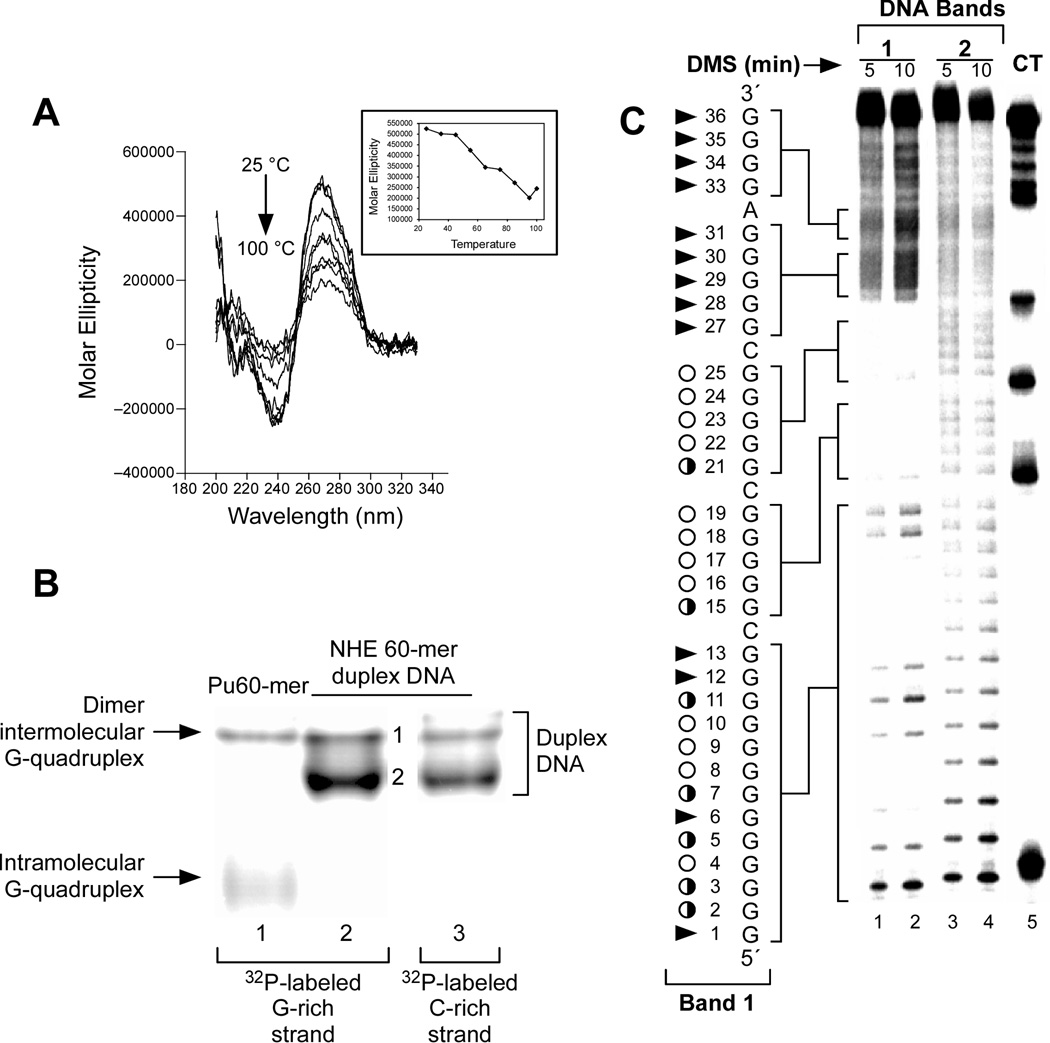
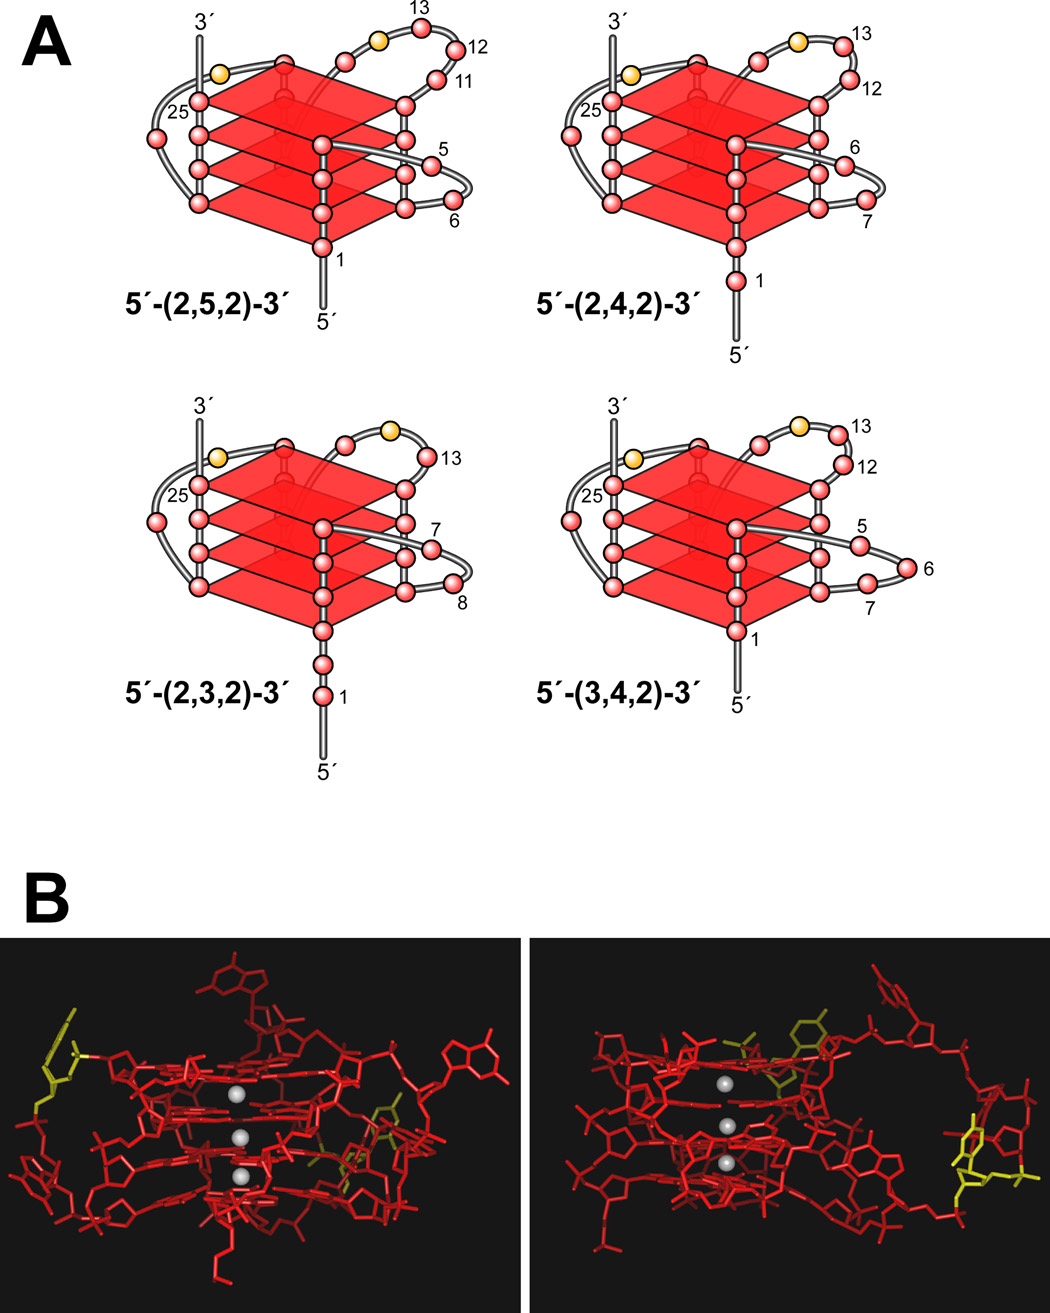
In its simplest form, a DNA G-quadruplex is a four-stranded DNA structure that is composed of stacked guanine tetrads. G-quadruplex-forming sequences have been identified in eukaryotic telomeres, as well as in non-telomeric genomic regions, such as gene promoters, recombination sites, and DNA tandem repeats. Of particular interest are the G-quadruplex structures that form in gene promoter regions, which have emerged as potential targets for anticancer drug development. Evidence for the formation of G-quadruplex structures in living cells continues to grow. In this review, we examine recent studies on intramolecular G-quadruplex structures that form in the promoter regions of some human genes in living cells and discuss the biological implications of these structures. The identification of G-quadruplex structures in promoter regions provides us with new insights into the fundamental aspects of G-quadruplex topology and DNA sequence-structure relationships. Progress in G-quadruplex structural studies and the validation of the biological role of these structures in cells will further encourage the development of small molecules that target these structures to specifically modulate gene transcription.


Figures

Figure 1
Figure 1
Structure of a G-tetrad and an example of the folding pattern of the known intramolecular G-quadruplex loop isomer (1:2:1) formed in the c-MYC promoter.
Figure 2
Figure 2
(A) Comparison of three-tetrad G-quadruplex-forming motifs (G3N1–3G3N2–9G3N1G3) within selected gene promoters. (B) One face of a three-tetrad G-quadruplex, showing a double-chain reversal loop containing one base.
Figure 3
Figure 3
(A) Promoter structure of the c-MYC gene, showing the c-MYC Pu27-mer sequence of the guanine-rich strand upstream of the P1 promoter [41]. (B) CD spectra of the d(GGA)4 oligonucleotide, the c-MYC Pu27-mer, the T30695 oligonucleotide, and the thrombin binding aptamer (TBA). (C) Proposed structures of the four different c-MYC G-quadruplex loop isomers, in which dual G-to-T mutations at positions 11, 14, 20, and 23 result in defined loop isomers. The upper row shows the four proposed isomers and the lower row shows the results of dual G-to-T mutations. In this and subsequent figures, guanines = red, cytosines = yellow, thymines = blue, and adenines = green. (D) Schematic structures of c-MYC (1:2:1), c-MYC (1:2:1)-G14T/G23T, and c-MYC (1:6:1)-G11T–G14T determined by NMR in K+ solution. (E) Diagram of the rearrangements involved in the Ramos and CA46 Burkitt’s lymphoma cell lines (modified from ref. 72). Downward arrows indicate the breakage and rejoining points between chromosomes 14 and 8 for each translocation. RT-PCR for c-MYC and β-actin in Ramos (lanes 1–3) and CA46 (lanes 4–6) cell lines after no treatment (lanes 1 and 4) and treatment with 100 µM TMPyP2 (lanes 2 and 5) and TMPyP4 (lanes 3 and 6) for 48 hr. (F) Model for the activation and repression of c-MYC gene transcription involving the conversion of the paranemic secondary DNA structures (gene off) to purine and pyrimidine single-stranded DNA forms for transcriptional activation. hnRNP K and CNBP are single-stranded DNA binding proteins involved in transcriptional activation. Interaction of the parallel G-quadruplex structure with TMPyP4 stabilizes the gene-off form by conversion to the proposed double-loop G-quadruplex structure that stabilizes the silencer element and results in transcriptional repression [42].
Figure 3
Figure 3
(A) Promoter structure of the c-MYC gene, showing the c-MYC Pu27-mer sequence of the guanine-rich strand upstream of the P1 promoter [41]. (B) CD spectra of the d(GGA)4 oligonucleotide, the c-MYC Pu27-mer, the T30695 oligonucleotide, and the thrombin binding aptamer (TBA). (C) Proposed structures of the four different c-MYC G-quadruplex loop isomers, in which dual G-to-T mutations at positions 11, 14, 20, and 23 result in defined loop isomers. The upper row shows the four proposed isomers and the lower row shows the results of dual G-to-T mutations. In this and subsequent figures, guanines = red, cytosines = yellow, thymines = blue, and adenines = green. (D) Schematic structures of c-MYC (1:2:1), c-MYC (1:2:1)-G14T/G23T, and c-MYC (1:6:1)-G11T–G14T determined by NMR in K+ solution. (E) Diagram of the rearrangements involved in the Ramos and CA46 Burkitt’s lymphoma cell lines (modified from ref. 72). Downward arrows indicate the breakage and rejoining points between chromosomes 14 and 8 for each translocation. RT-PCR for c-MYC and β-actin in Ramos (lanes 1–3) and CA46 (lanes 4–6) cell lines after no treatment (lanes 1 and 4) and treatment with 100 µM TMPyP2 (lanes 2 and 5) and TMPyP4 (lanes 3 and 6) for 48 hr. (F) Model for the activation and repression of c-MYC gene transcription involving the conversion of the paranemic secondary DNA structures (gene off) to purine and pyrimidine single-stranded DNA forms for transcriptional activation. hnRNP K and CNBP are single-stranded DNA binding proteins involved in transcriptional activation. Interaction of the parallel G-quadruplex structure with TMPyP4 stabilizes the gene-off form by conversion to the proposed double-loop G-quadruplex structure that stabilizes the silencer element and results in transcriptional repression [42].
Figure 4
Figure 4
(A) Promoter structure of the VEGF gene. The polypurine/polypyrimidine sequence is shown, together with the five GC boxes [45]. (B) Plasmid footprinting of the VEGF promoter region with S1 nuclease. The footprinting of the top strand of the supercoiled plasmid is shown in the left panel. The densitometric scanning of the S1 footprinting on top strand is shown in the right panel. Lane 1 = no salt, lane 2 = 100 mM KCl, lane 3 = 1 µM telomestatin. Arrows indicate the sites that are hypersensitive to S1 nuclease at the 3′-side of the G-quadruplex-forming region [45]. Guanines in bold are those associated with the quadruplex. (C) Plasmid footprinting of the top strand of the mutant VEGF promoter region with DNase I and S1 nuclease. The plasmid was incubated in the absence of salt (lanes 1 and 4), in the presence of 100 mM K+ (lanes 2 and 5), or with 1 µM K+ (lanes 3 and 6) at 37 °C for 1 hour before treating with nuclease [45]. Guanines in bold are those associated with the quadruplex. Asterisks indicate mutated guanines (G to A).
Figure 4
Figure 4
(A) Promoter structure of the VEGF gene. The polypurine/polypyrimidine sequence is shown, together with the five GC boxes [45]. (B) Plasmid footprinting of the VEGF promoter region with S1 nuclease. The footprinting of the top strand of the supercoiled plasmid is shown in the left panel. The densitometric scanning of the S1 footprinting on top strand is shown in the right panel. Lane 1 = no salt, lane 2 = 100 mM KCl, lane 3 = 1 µM telomestatin. Arrows indicate the sites that are hypersensitive to S1 nuclease at the 3′-side of the G-quadruplex-forming region [45]. Guanines in bold are those associated with the quadruplex. (C) Plasmid footprinting of the top strand of the mutant VEGF promoter region with DNase I and S1 nuclease. The plasmid was incubated in the absence of salt (lanes 1 and 4), in the presence of 100 mM K+ (lanes 2 and 5), or with 1 µM K+ (lanes 3 and 6) at 37 °C for 1 hour before treating with nuclease [45]. Guanines in bold are those associated with the quadruplex. Asterisks indicate mutated guanines (G to A).
Figure 5
Figure 5
DMS footprinting on the G-rich DNA oligomer derived from the HIF-1α promoter in the absence (−) or presence (+) of 140 mM K+. The sequence of the HIF-1α G-rich oligomer is shown adjacent to the gel. Open circles indicate the guanines that are fully protected, and the solid circles indicate the guanines that are cleaved [46].
Figure 6
Figure 6
(A) Promoter structure of the RET gene. Two GC boxes are highlighted. Five guanine tracts (I, II, III, IV, V) are indicated with braces [47]. (B) Proposed G-quadruplex structure for the G-rich DNA oligomer of the RET promoter. The sequence of this G-rich strand DNA is shown under the structure, together with the pol stop sites (arrows). (C) Cytosine+– cytosine base pair in the i-motif (left). Schematic structure of an i-motif formed in the C-rich DNA oligomer of the RET promoter (right). The sequence of this C-rich strand DNA is shown under the structure. (D) Molecular model of the RET promoter sequence (−66 to −19) with i-motif, G-quadruplex, and duplex DNA regions (adenine, green; guanine, red; thymine, blue; cytosine, yellow; potassium ions, white). The symmetrical arrangement of RET C-rich and G-rich sequences is shown below the model.
Figure 7
Figure 7
Schematic structure and folding topology of a c-kit87up G-quadruplex determined by NMR [53]. Sequence for c-kit87up is shown below the structure. Guanines in red are those involved in tetrad formation.
Figure 8
Figure 8
(A) Diagram of the promoter region of the Bcl-2 gene. Shown in the inset is the core sequence of the G-quadruplex-forming region in the Bcl-2 promoter. Guanine tracts are underlined. Different groups of five contiguous G-tracts (Bcl-2 3′G4, Bcl-2 MidG4, Bcl-2 5′G4,) within the G-rich strand are indicated with braces [49]. (B) G-quadruplex folding pattern of the Bcl-2 MidG4-G15T/G16T determined by NMR [50].
Figure 9
Figure 9
Effect of K+ and Na+ on the formation of the PDGF-A NHE G-quadruplex in a Taq polymerase stop assay. Two stop products are designated as the 5′-end product and 3′-end product. The corresponding arrest sites are indicated on the core PDGF-A Pu41-mer sequence [56].
Figure 10
Figure 10
(A) Effect of temperature (25–100 °C) on the CD spectra of 90-bp duplex DNA containing the PDGF-A Pu41-mer. At 100 °C, the 90-bp duplex DNA still generates a strong G-quadruplex CD signal. (B) Nondenatured gel analysis of 60-mer G-rich single-stranded DNA containing the PDGF-A Pu41-mer (lane 1) and 60-bp double-stranded DNA, also containing the PDGF-A Pu41-mer (lanes 2 and 3). In lanes 1 and 2, the G-rich strand was 5′-end-radiolabeled with 32P, and the C-rich strand was 5′-end-radiolabeled with 32P in lane 3. (C) DMS footprinting of G-rich strands of 60-bp duplex DNA band 1 (lanes 1 and 2) and band 2 (lanes 3 and 4). Lane 5 shows the CT sequencing on the G-rich strand of the 60-bp duplex DNA. Open circles indicate the guanines that are fully protected, partially open circles indicate the guanines that are partially protected, and arrowheads indicate the guanines that are cleaved [56].
Figure 11
Figure 11
(A) Proposed folding patterns of the four different loop isomers formed in the core sequence of PDGF-A. (B) Model of the biologically relevant PDGF-A NHE G-quadruplex (loop isomer 5′-(2,5,2)-3′), which contains two 2-base double-chain reversal loops and one 5-base intervening loop (K+ ions = white). For clarity, hydrogen atoms have not been shown. In the left panel, the two 2-base double-chain reversal loops are shown on each side of the model, and in the right panel, the model has been rotated to show the 5-base intervening loop on the right side of the model [56].
Figure 12
Figure 12
(A) Structures of the G-quadruplex-interactive compounds TMPyP4, telomestatin, and Se2SAP, and the control compound TMPyP2. (B) The Taq polymerase stop assay was used to compare the stabilization of the PDGF-A G-quadruplexes by TMPyP2 (lanes 3–7), TMPyP4 (lanes 8–12), telomestatin (lanes 13–17), and Se2SAP (lanes 18–22) by using increasing concentrations of drugs (0.01, 0.05, 0.5, 1, and 2.5 µM) at 60 °C. Lane 1 is control and lane 2 is without drug. (C) The ratios of the major arrest products of each sample to the total product were plotted against drug concentrations. (D) Dual luciferase assay to determine the effect of TMPyP4 and TMPyP2 on the transcriptional activity of PDGF-A basal promoter containing the NHE. The comparative firefly luciferase expressions (firefly/renilla) of TMPyP2 and TMPyP4 are shown in the histograms [56].
Figure 12
Figure 12
(A) Structures of the G-quadruplex-interactive compounds TMPyP4, telomestatin, and Se2SAP, and the control compound TMPyP2. (B) The Taq polymerase stop assay was used to compare the stabilization of the PDGF-A G-quadruplexes by TMPyP2 (lanes 3–7), TMPyP4 (lanes 8–12), telomestatin (lanes 13–17), and Se2SAP (lanes 18–22) by using increasing concentrations of drugs (0.01, 0.05, 0.5, 1, and 2.5 µM) at 60 °C. Lane 1 is control and lane 2 is without drug. (C) The ratios of the major arrest products of each sample to the total product were plotted against drug concentrations. (D) Dual luciferase assay to determine the effect of TMPyP4 and TMPyP2 on the transcriptional activity of PDGF-A basal promoter containing the NHE. The comparative firefly luciferase expressions (firefly/renilla) of TMPyP2 and TMPyP4 are shown in the histograms [56].
Figure 13
Figure 13
(A) Promoter structure of the c-Myb gene and the location of key transcription factors; shown in the inset is the sequence of three (GGA)4 repeats downstream of the transcriptional initiation site of the c-Myb promoter. (B) The intermolecular and intramolecular T:H:H:T G-quadruplexes formed by d(GGA)4 and d(GGA)8. (C) Luciferase activity driven by the wild-type and GGA-deleted c-Myb promoter constructs in CCRF-CEM cells. Deletion of R1, R2, R3, or both R1 and R2 from the c-myb promoter increases luciferase activity in CCRT-CEM cells. The R1, R2, and R3 deletion mutant pMybDelR1/2/3 markedly reduces luciferase activity (* P value < 0.01) [57].
Figure 13
Figure 13
(A) Promoter structure of the c-Myb gene and the location of key transcription factors; shown in the inset is the sequence of three (GGA)4 repeats downstream of the transcriptional initiation site of the c-Myb promoter. (B) The intermolecular and intramolecular T:H:H:T G-quadruplexes formed by d(GGA)4 and d(GGA)8. (C) Luciferase activity driven by the wild-type and GGA-deleted c-Myb promoter constructs in CCRF-CEM cells. Deletion of R1, R2, R3, or both R1 and R2 from the c-myb promoter increases luciferase activity in CCRT-CEM cells. The R1, R2, and R3 deletion mutant pMybDelR1/2/3 markedly reduces luciferase activity (* P value < 0.01) [57].

Similar articles

Cited by

References

    1. Watson JD, Crick FHC. Molecular structure of nucleic acids: a structure for deoxyribose nucleic acid. Nature. 1953;171:737–738. - PubMed
    1. Wells RD. Unusual DNA structures. J Biol Chem. 1988;263:1095–1098. - PubMed
    1. Wells RD. Non-B DNA conformations, mutagenesis and disease. Trends Biochem Sci. 2007;32:271–278. - PubMed
    1. Raghavan SC, Lieber MR. DNA structure and human diseases. Front Biosci. 2007;12:4402–4408. - PubMed
    1. Bacolla A, Wells RD. Non-B DNA conformations, genomic rearrangements, and human disease. J Biol Chem. 2004;279:47411–47414. - PubMed

Publication types

LinkOut - more resources