

Analysis of genomic admixture in Uyghur and its implication in mapping strategy
- PMID: 18355773
- PMCID: PMC2427216
- DOI: 10.1016/j.ajhg.2008.01.017
Analysis of genomic admixture in Uyghur and its implication in mapping strategy
Abstract
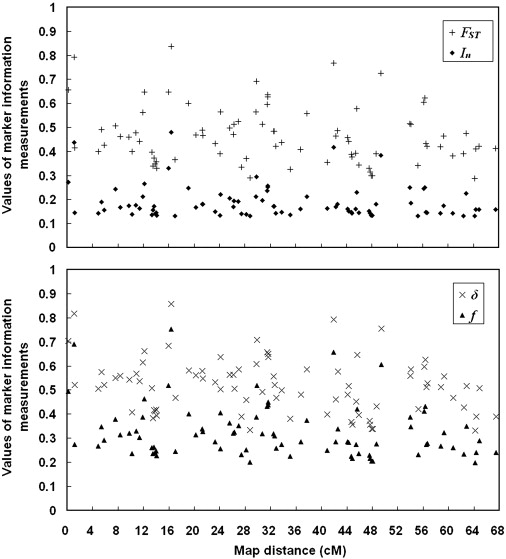
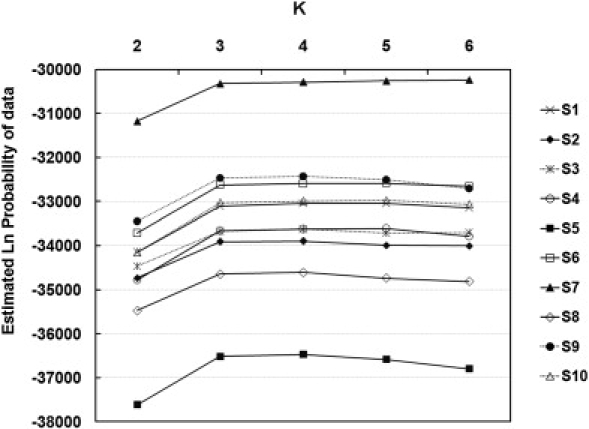
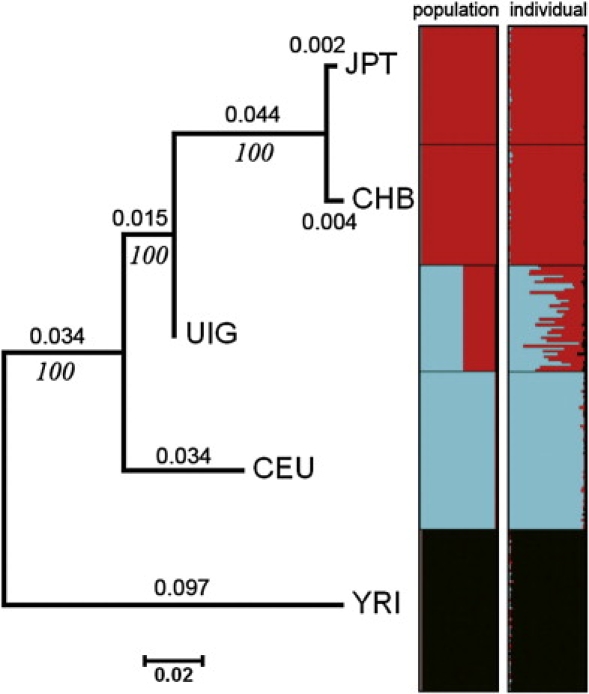
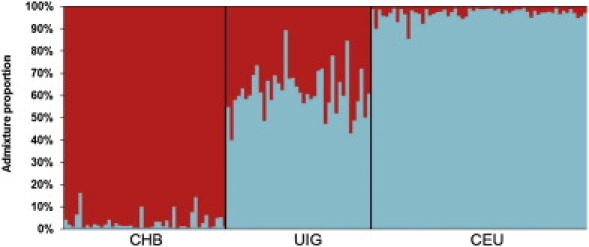
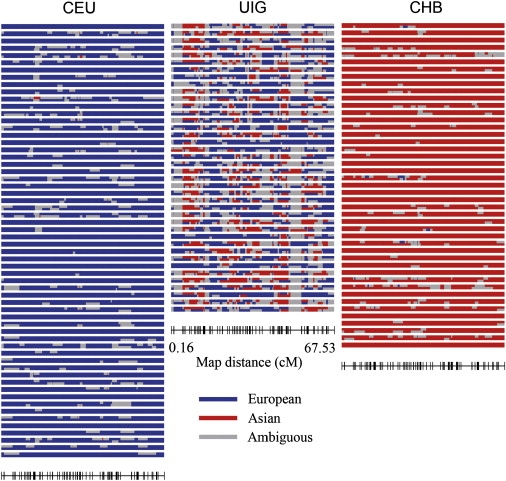
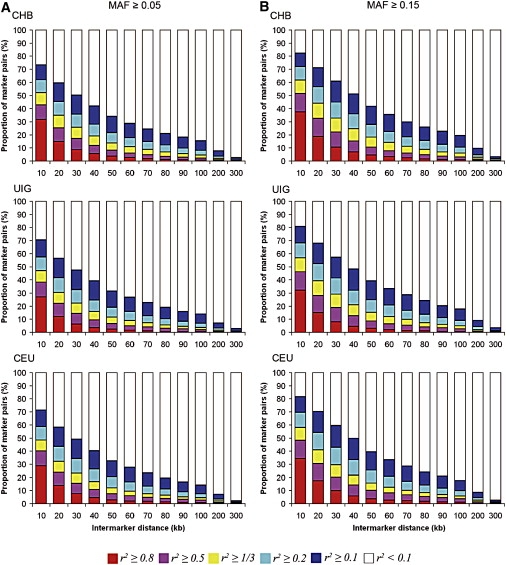
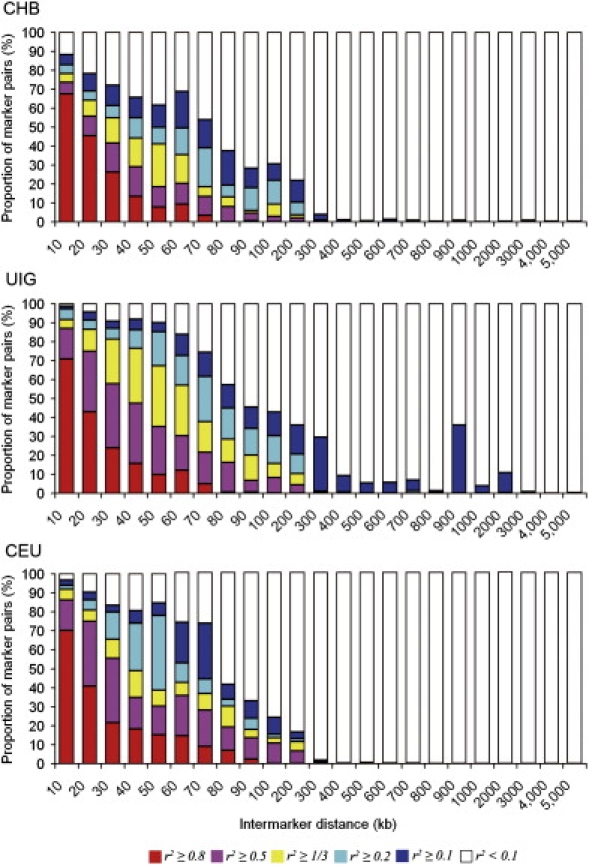
The Uyghur (UIG) population, settled in Xinjiang, China, is a population presenting a typical admixture of Eastern and Western anthropometric traits. We dissected its genomic structure at population level, individual level, and chromosome level by using 20,177 SNPs spanning nearly the entire chromosome 21. Our results showed that UIG was formed by two-way admixture, with 60% European ancestry and 40% East Asian ancestry. Overall linkage disequilibrium (LD) in UIG was similar to that in its parental populations represented in East Asia and Europe with regard to common alleles, and UIG manifested elevation of LD only within 500 kb and at a level of 0.1 <r(2) < 0.8 when ancestry-informative markers (AIMs) were used. The size of chromosomal segments that were derived from East Asian and European ancestries averaged 2.4 cM and 4.1 cM, respectively. Both the magnitude of LD and fragmentary ancestral chromosome segments indicated a long history of Uyghur. Under the assumption of a hybrid isolation (HI) model, we estimated that the admixture event of UIG occurred about 126 [107 approximately 146] generations ago, or 2520 [2140 approximately 2920] years ago assuming 20 years per generation. In spite of the long history and short LD of Uyghur compared with recent admixture populations such as the African-American population, we suggest that mapping by admixture LD (MALD) is still applicable in the Uyghur population but approximately 10-fold AIMs are necessary for a whole-genome scan.
Figures


Comment in
-
Genetic landscape of Eurasia and "admixture" in Uyghurs.Am J Hum Genet. 2009 Dec;85(6):934-7; author reply 937-9. doi: 10.1016/j.ajhg.2009.10.024. Am J Hum Genet. 2009. PMID: 20004770 Free PMC article. No abstract available.
References
-
- Norton H.L., Kittles R.A., Parra E., McKeigue P., Mao X., Cheng K., Canfield V.A., Bradley D.G., McEvoy B., Shriver M.D. Genetic evidence for the convergent evolution of light skin in Europeans and East Asians. Mol. Biol. Evol. 2007;24:710–722. - PubMed
-
- Cui Y., Zhou H. Analysis of genetic structure of the ancient Xinjiang population. Journal of the Central University for Nationalities. 2004;31:34–36.
-
- Xiao F.X., Yang J.F., Cassiman J.J., Decorte R. Diversity at eight polymorphic Alu insertion loci in Chinese populations shows evidence for European admixture in an ethnic minority population from northwest China. Hum. Biol. 2002;74:555–568. - PubMed
-
- Perez-Lezaun A., Calafell F., Comas D., Mateu E., Bosch E., Martinez-Arias R., Clarimon J., Fiori G., Luiselli D., Facchini F. Sex-specific migration patterns in Central Asian populations, revealed by analysis of Y-chromosome short tandem repeats and mtDNA. Am. J. Hum. Genet. 1999;65:208–219. - PMC - PubMed
Publication types
MeSH terms
LinkOut - more resources
Full Text Sources
Research Materials
