Comparative Study
. 2008 May;38(1):53-65.
doi: 10.1016/j.mcn.2008.01.015. Epub 2008 Feb 13.

Receptor tyrosine phosphatases regulate birth order-dependent axonal fasciculation and midline repulsion during development of the Drosophila mushroom body

Affiliations
Comparative Study

Receptor tyrosine phosphatases regulate birth order-dependent axonal fasciculation and midline repulsion during development of the Drosophila mushroom body

Mitsuhiko Kurusu et al. Mol Cell Neurosci. 2008 May.

Abstract

Receptor tyrosine phosphatases (RPTPs) are required for axon guidance during embryonic development in Drosophila. Here we examine the roles of four RPTPs during development of the larval mushroom body (MB). MB neurons extend axons into parallel tracts known as the peduncle and lobes. The temporal order of neuronal birth is reflected in the organization of axons within these tracts. Axons of the youngest neurons, known as core fibers, extend within a single bundle at the center, while those of older neurons fill the outer layers. RPTPs are selectively expressed on the core fibers of the MB. Ptp10D and Ptp69D regulate segregation of the young axons into a single core bundle. Ptp69D signaling is required for axonal extension beyond the peduncle. Lar and Ptp69D are necessary for the axonal branching decisions that create the lobes. Avoidance of the brain midline by extending medial lobe axons involves signaling through Lar.


Figures
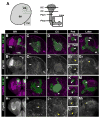
FIG 1
FIG 1. RPTPs are selectively expressed on young axons in the third-instar larval MB
Brains from OK107-GAL4, UAS-mCD8-GFP larvae were stained with mAbs against RPTPs (magenta and white) and visualized using confocal microscopy. The GFP signal is green. In each pair of panels (e.g. B and B1), the first (color) shows both signals, and the second (black and white) shows only the RPTP signal. (B,H,N,T) Reconstructions of optical sections. The remainder of the panels show single optical sections, with their positions indicated by planes through the MB diagram in (A). In each panel, the arrowheads indicate regions showing selective expression of the RPTP. See text for interpretation. (A) Schematic representations of brain and MB. (B–G and B1–G1) Ptp10D expression. (H–M and H1–M1) Ptp69D expression. (N–S and N1–S1) Ptp99A expression. (T–Y and T1–Y1) Lar expression. (F2, K2, R2, X2) Higher magnification views of the F, F1, K, K1, R, R1, X, and X1 panels. Abbreviations: BR, brain; OL, optic lobe; MB, mushroom body; VNC, ventral nerve cord; KC, Kenyon cell body clusters; CX, calyx; Ped, peduncle; DL, dorsal lobe; ML, medial lobe. Bar in (B), 50 μm: applies also to (H,N,T); bar in (C), 20 μm: applies also to (C–G, I–M, O–S, and U–Y).
FIG. 2
FIG. 2. RPTPs are expressed in the neuropil of the adult brain
Brains from OK107::mCD8-GFP animals are shown, stained with anti-RPTP (magenta/white) as in Fig. 1. (A,A1,D,D1,G,G1,J, and J1) Reconstructions of optical sections. The rest of the panels show single optical sections, focusing on MB medial lobes (B, B1,E,E1,H,H1,K, and K1) and dorsal lobes (C,C1,F,F1,I,I1,L and L1). In each pair of panels, the upper (color) shows both the anti-RPTP and GFP signals, so that the MB is labeled in green, while the lower (black and white) shows only the anti-RPTP signal. (A–C and A1–C1) Ptp10D expression. Note that the ALs (arrowhead) are much brighter than the rest of the brain. The MB lobes are prominent in (B1) and (C1). (D–F and D1–F1) Ptp69D expression. (G–I and G1–I1) Ptp99A expression. All neuropils are stained brightly by anti-Ptp99A. Note that the medial lobes of the MBs are brighter than the surrounding structures (arrowheads). (J–L and J1–L1) Lar expression. The MB medial lobes are also prominent (arrowheads). Bar in (A), 50 μm: applies also to (D, G, and J); bar in (B), 20 μm: applies also to (C, E–F, H–I, and K–L).
FIG. 3
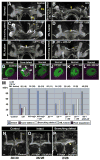
FIG. 3. Core splitting and branching defects in Ptp10D mutants
Third instar larval brains (A–F) and adult brains (N–P), showing morphologies of MB lobes visualized with anti-Fas II. Reconstructions of optical sections are shown. (A) Wild-type control. (B) ML fusion and branching defect, in a Δ59 hemizygote. The MLs from the two hemispheres are fused at the midline (arrowhead). The dorsal lobe in the right hemisphere is very thin (open arrowhead). (C) A Ptp10D1 MB with a branching defect, showing a thin dorsal lobe in the right hemisphere (open arrowhead). (D) MB from a Ptp10D1/Δ59 transheterozygote, showing an ML fusion (arrowhead). (E) bifR47/Δ59, also showing ML fusion (arrowhead). (F) Δ59 with UAS-Bif driven by OK107. The ML is very thin (arrowhead). (G–L) Single optical sections through the peduncle, showing core fiber bundles labeled with phalloidin (magenta) and Fas II expression on surrounding axons (green). (G) Wild-type control. Note the single magenta spot within the green peduncle tract. (H) Core defect, in a Δ59 MB. Three distinct magenta core fiber bundles are observed (arrowheads). (I–L) Normal peduncles, in four different genotypes. (M) Bar graph showing phenotypic penetrances in Ptp10D and bif mutants, mutant combinations, and rescued genotypes. Note that the bar height for ML fusion indicates the % of brains affected, while those for other phenotypes indicate the % of MBs affected. (N) Wild-type control brain. The α, β, and γ lobes, which express FasII, are indicated. All wild-type MBs (30/30 brains) had this morphology. (O) 26/28 Ptp99A1/Df(3R)R3 brains had normal MB morphologies. (P) 2/28 Ptp99A1/Df(3R)R3 brains had an MB with a branching defect in which the α lobe is missing and the β lobe is enlarged. Bar in (A), 20 μm: applies also to (B–F); bar in (G), 10 μm: applies also to (H–L); bar in (N), 20 μm: applies also to (O and P).
FIG. 4
FIG. 4. Ptp69D MB phenotypes: core splitting and loss of projections into the lobes
(A–D): third-instar larval brain hemispheres stained with anti-FasII (green/white) and phalloidin (magenta/white). (A) and (C) show low-magnification color views of wild-type (A) and Ptp69D1/Df(3L)8ex25 (C) brain hemispheres, while panels A1,A2,C1,C2 show black and white views of separated channels from the same images. (B) and (D) are high-magnification views of the FasII signal from the same brains, showing MB morphology. Reconstructions of optical sections are shown. OL, optic lobe; ML, medial MB lobe; DL, dorsal MB lobe. The arrowheads in (C1) and (D) indicate the MB remnant structure observed in Ptp69D brains. Reconstructions of optical sections (E–G, J–K), and single optical sections through the peduncle (H–I, L–M), from OK107::mCD8-GFP larvae (E–I) or 201Y::mCD8-GFP larvae (J–M). (E–G) and (L–K) show the GFP signal, in white, while (H–I) and (L–M) show the GFP signal in green and phalloidin in magenta. (E) Control. The heel region is labeled (H), as are the DL and ML. (F–G) Larvae expressing Ptp69DDA3 from OK107. In (F) the heel is expanded (arrowhead) and the DL and ML are thin (open arrowheads). In (G) the heel is expanded and the DL is much larger than the ML, indicating a branching defect. (H) Control peduncle section. Note the single magenta core fiber bundle. (I) Peduncle section from an OK107::Ptp69DDA3 larva. The core fibers are split into several distinct bundles (arrowheads). (J) Control MB, showing the 201Y::GFP signal. (K) MB from a 201Y:: Ptp69DDA3 larva, showing normal morphology. (L) Control peduncle section. The single core fiber bundle and surrounding older green axons are also seen with 201Y::GFP. (M) Peduncle section from a 201Y::Ptp69DDA3 larva, showing a normal core fiber bundle. (N) Bar graph showing phenotypic penetrances in larvae expressing Ptp69DDA3. Bar heights indicate the % of MBs of the indicated genotypes that display the various phenotypes. (O) Control NB MARCM clone. KCs, heel (H), calyx (CX), and dorsal (DL) and medial (ML) lobes are indicated. (P) Ptp69DD1689 NB clone, displaying severe axon guidance phenotypes. Closed arrowhead, expanded heel; open arrowhead, disappearance of ML; closed arrow, defasciculation of axons beneath calyx; open arrow, ectopic projection of axons into the iACT (the route taken by axons of antennal lobe neurons that project to the calyx). Bar in (A), 50 μm: applies also to (C); bar in (B), 20 μm: applies also to (D, E–G, and J–K); bar in (H), 10 μm: applies also to (I and L–M); bar in (O), 20 μm: applies also to (P).
FIG. 5
FIG. 5. Lar MB phenotypes: medial lobe fusion and branching defects
(A–D) Third instar larval brain hemispheres stained with anti-FasII to reveal MB morphologies. Reconstructions of optical sections are shown. Open arrowheads indicate dorsal lobes (DL); closed arrowheads indicate medial lobes (ML). (A) Wild-type control. (B) Lar5.1/Lar13.2 transheterozygote. One DL is thin and the other absent, and the MLs are fused across the midline. (C) Lar5.5/Lar13.2 transheterozygote. Same phenotype as in (B). (D) LarOD5/Lar13.2 transheterozygote. Both DLs are absent and the MLs are fused. (E–I) MARCM NB clones (positively labeled with mCD8-GFP), examined at third-instar larval stage (E–F) or in adults (G–I). GFP signal is in green, and anti-FasII in magenta, in (E1) and (F1), which are higher-magnification views; (E) and (F) show the GFP signal alone, in white. The brain midline is indicated by a yellow vertical bar in (E) and (F). (E, E1): control clone, showing the calyx (CX), DL, and ML. Note that the end of the ML portion of the clone is to the left of the brain midline. (F,F1): Lar5.5 clone. Note that the ML axons extend beyond the brain midline (arrowheads), and enter the contralateral ML lobe (arrowhead in F1). (G–I) Adult clones, visualized with mCD8-GFP (green) and anti-FasII (magenta). (G) Control clone. The α, α′, β, and γ lobes are indicated. (H) Lar5.5 clone. Note that some β lobe axons (arrowhead) extend across the brain midline and contact the contralateral anti-FasII-stained β lobe. (I) Lar451 clone. The α lobe portion of the clone is missing, and the β lobe is doubled in thickness (arrowhead), indicating a defect in branching. (J–K): single cell/two-cell MARCM clones, showing dendritic endings in the calyx. The dendrites end in “claw-like” terminals (arrowheads). (J) Control clone. (K) Lar5.5 clone. No obvious difference in morphology of the dendritic endings is seen. (L) Bar graph of phenotypic penetrances in Lar mutant larvae. Note that the bar height for ML fusion indicates the % of brains affected, while those for other phenotypes indicate the % of MBs affected. (M) Bar graph of phenotypic penetrances in Lar mutant NB clones examined at the larval or adult stages. Bar in (A), 20 μm: applies also to (B–D); bar in (E), 20 μm: applies also to (F); bar in (E1), 20 μm: applies also to (F1) ; bar in (G), 20 μm: applies also to (H–I); bar in (J), 10 μm: applies also to (K).

Similar articles

Cited by

References

    1. Aricescu AR, McKinnell IW, Halfter W, Stoker AW. Heparan sulfate proteoglycans are ligands for receptor protein tyrosine phosphatase sigma. Molecular and cellular biology. 2002;22:1881–1892. - PMC - PubMed
    1. Babu K, Bahri S, Alphey L, Chia W. Bifocal and PP1 interaction regulates targeting of the R-cell growth cone in Drosophila. Developmental biology. 2005;288:372–386. - PubMed
    1. Babu K, Cai Y, Bahri S, Yang X, Chia W. Roles of Bifocal, Homer, and F-actin in anchoring Oskar to the posterior cortex of Drosophila oocytes. Genes & development. 2004;18:138–143. - PMC - PubMed
    1. Bahri SM, Yang X, Chia W. The Drosophila bifocal gene encodes a novel protein which colocalizes with actin and is necessary for photoreceptor morphogenesis. Molecular and cellular biology. 1997;17:5521–5529. - PMC - PubMed
    1. Clandinin TR, Lee CH, Herman T, Lee RC, Yang AY, Ovasapyan S, Zipursky SL. Drosophila LAR regulates R1–R6 and R7 target specificity in the visual system. Neuron. 2001;32:237–248. - PubMed

Publication types

MeSH terms

Substances

LinkOut - more resources