. 2008 May 1;40(4):1686-700.
doi: 10.1016/j.neuroimage.2008.01.023. Epub 2008 Jan 31.

Five-dimensional neuroimaging: localization of the time-frequency dynamics of cortical activity

Affiliations

Five-dimensional neuroimaging: localization of the time-frequency dynamics of cortical activity

Sarang S Dalal et al. Neuroimage. .

Abstract

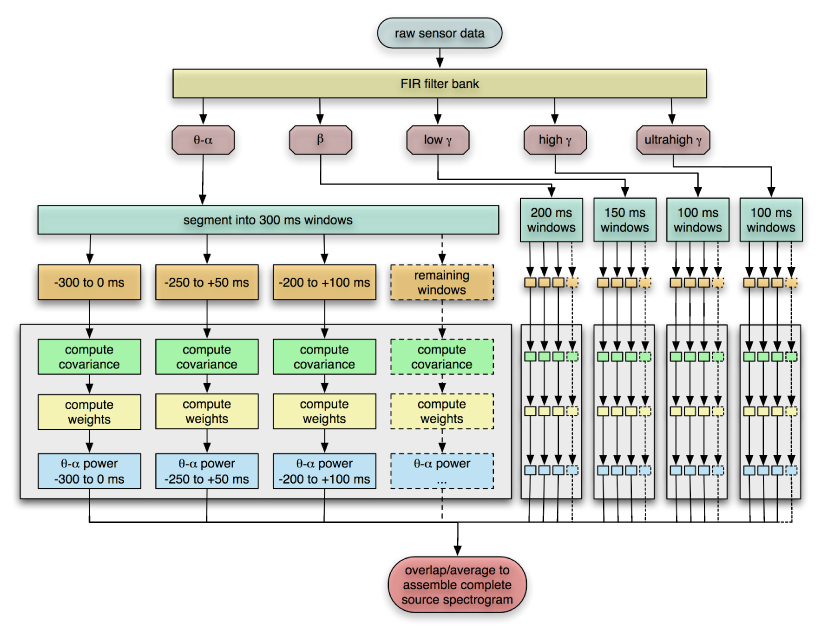
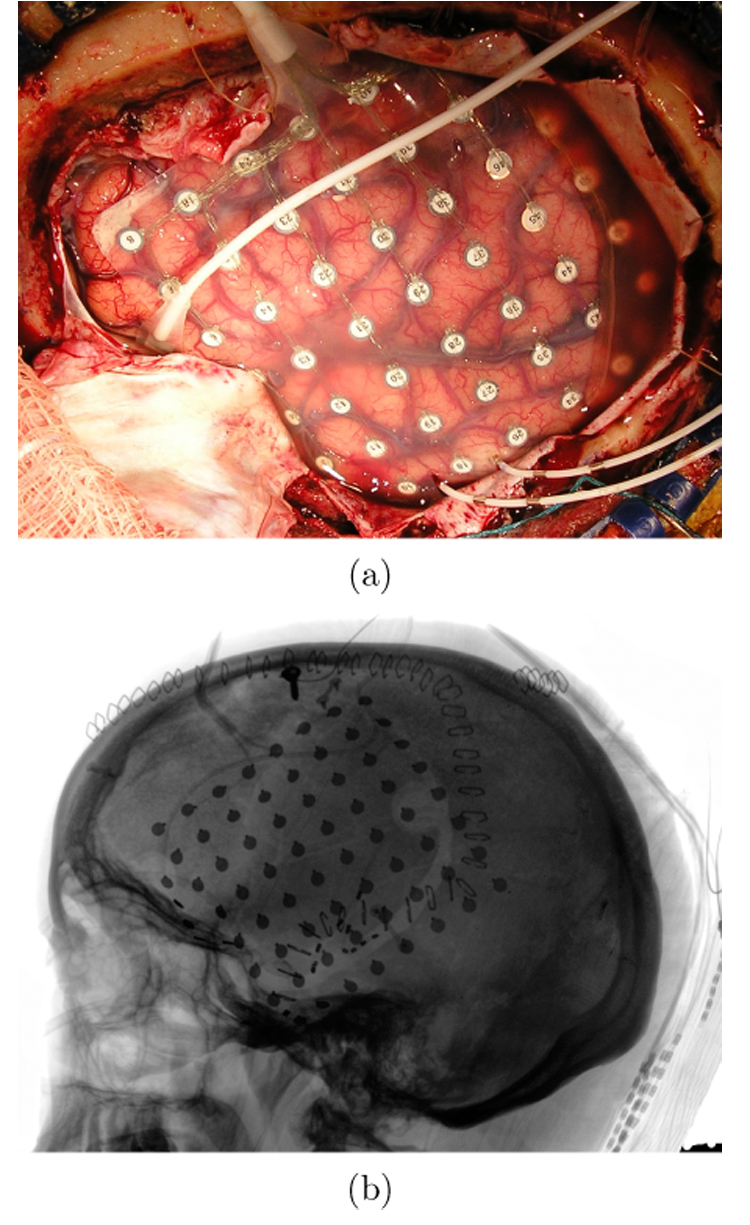
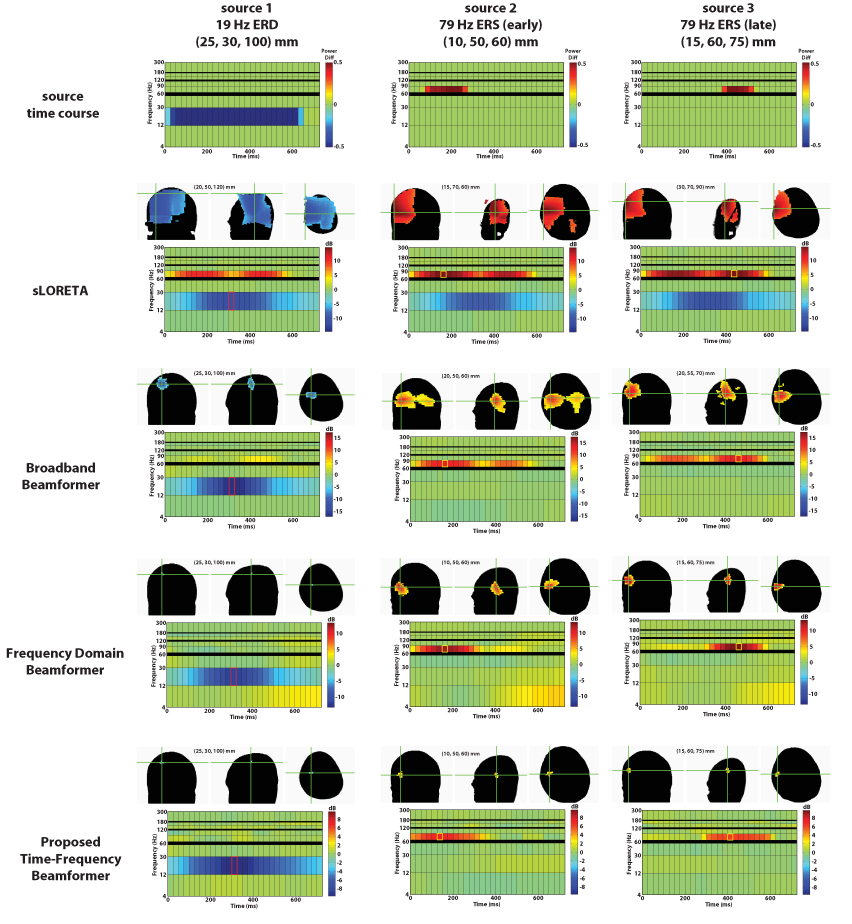
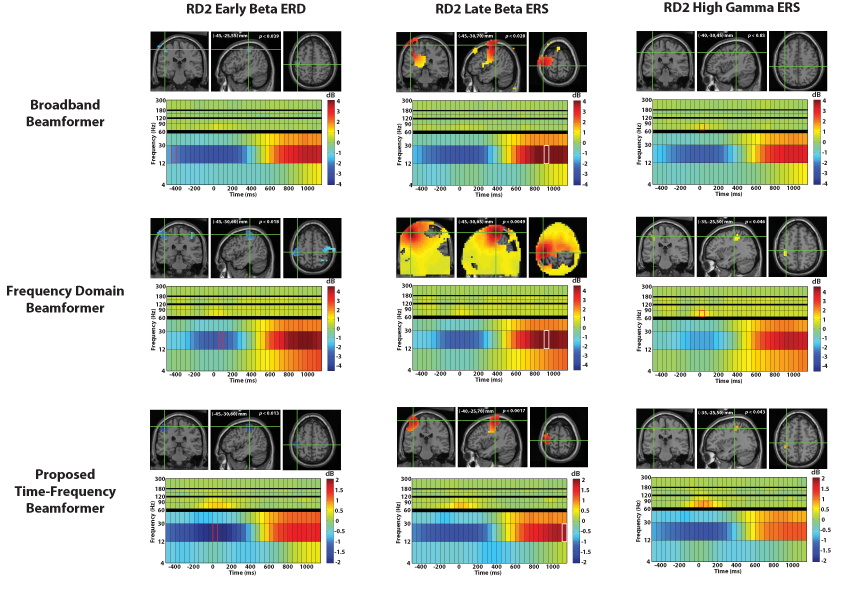
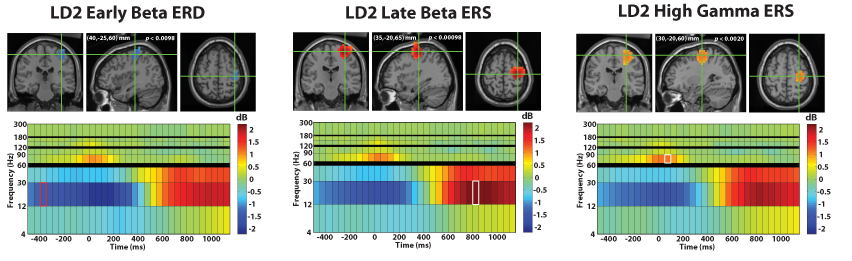
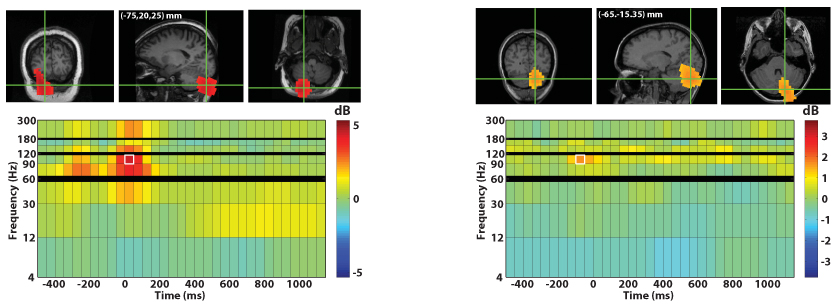
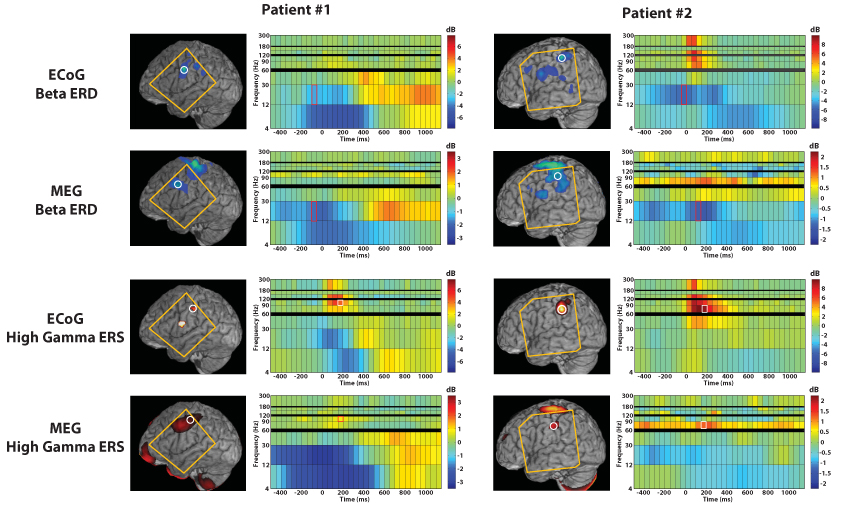
The spatiotemporal dynamics of cortical oscillations across human brain regions remain poorly understood because of a lack of adequately validated methods for reconstructing such activity from noninvasive electrophysiological data. In this paper, we present a novel adaptive spatial filtering algorithm optimized for robust source time-frequency reconstruction from magnetoencephalography (MEG) and electroencephalography (EEG) data. The efficacy of the method is demonstrated with simulated sources and is also applied to real MEG data from a self-paced finger movement task. The algorithm reliably reveals modulations both in the beta band (12-30 Hz) and high gamma band (65-90 Hz) in sensorimotor cortex. The performance is validated by both across-subjects statistical comparisons and by intracranial electrocorticography (ECoG) data from two epilepsy patients. Interestingly, we also reliably observed high frequency activity (30-300 Hz) in the cerebellum, although with variable locations and frequencies across subjects. The proposed algorithm is highly parallelizable and runs efficiently on modern high-performance computing clusters. This method enables the ultimate promise of MEG and EEG for five-dimensional imaging of space, time, and frequency activity in the brain and renders it applicable for widespread studies of human cortical dynamics during cognition.


Figures

Fig. 1
Fig. 1
Algorithm for optimal time-frequency beamforming. Processing of the combined θ-α band is shown in detail; each of the other frequency bands has a similar workflow. Note that the algorithm is highly parallel and well-suited to run on high performance computing clusters.
Fig. 2
Fig. 2
(a) Example of a typical frontotemporal ECoG montage in an intractable epilepsy patient. The implant consists of an 8×8 electrode grid with 10 mm center-to-center spacing between electrodes. (b) Lateral X-ray radiograph of the same patient showing electrode locations. The surgical photograph was used to annotate the locations of visible electrodes on an MRI rendering, while the coordinates of hidden electrodes were found using X-ray backprojection to the MRI-derived brain surface (Dalal et al., 2007).
Fig. 3
Fig. 3
At top is the spectrogram corresponding to the three simulated sources. In the rows below are the reconstruction results using sLORETA, the broadband beamformer, the frequency domain beamformer, and the proposed time-frequency beamformer. In each of those panels, the crosshairs mark the spatiotemporal peak for the reconstructed source, with the corresponding spectrogram shown below it. The time-frequency window plotted on the MRI is highlighted on the spectrogram. The functional maps are thresholded at 50% of the maximum power (in dB) for the beamformer variants and 75% for sLORETA.
Fig. 4
Fig. 4
Shown above are the grand average reconstruction results for right index finger movement using the broadband beamformer, the frequency domain beamformer, and the proposed time-frequency beamformer. The functional maps are superimposed on the MNI template brain and are statistically thresholded at p < 0:05 (corrected). In each of the panels, the crosshairs mark the spatiotemporal peak for the reconstructed source, with the corresponding spectrogram shown below it. The functional map plotted on the MRI corresponds to the time-frequency window highlighted on the spectrogram. Note that the frequency-domain beamformer localized peaks similar to the other methods, but grossly overestimated the statistically significant spatial extent of the late beta ERS, likely due to a large baseline shift of inactive voxels.
Fig. 5
Fig. 5
Shown above are the grand average reconstruction results for left index finger movement using the proposed time-frequency beamformer, superimposed on the MNI template brain. The functional maps are superimposed on the MNI template brain and are statistically thresholded at p < 0:05 (corrected). In each panel, the crosshairs mark the spatiotemporal peak for the reconstructed source, with the corresponding spectrogram shown below it. The functional map plotted on the MRI corresponds to the time-frequency window highlighted on the spectrogram.
Fig. 6
Fig. 6
Above, examples of cerebellum activation for finger movement in two subjects. Above left are the results for RD2 movement in one subject. Above right are the results for LD2 movement in a different subject. Both functional maps are thresholded at 75% of the maximum power (in dB).
Fig. 7
Fig. 7
Shown above are the right finger (RD2) movement activity for two intractable epilepsy patients, using both time-frequency analyses from an 8×8 intracranial electrode grid and the corresponding results from preoperative magnetoencephalography and the proposed time-frequency beamformer. The spectrogram corresponds to the circled spatial location, while the functional maps show the spatial extent of activation for the indicated time window and frequency band. The orange outline indicates the region covered by the intracranial electrode grid. Note that MEG reveals strong primary motor cortex and cerebellum activity, but these areas were not covered with electrodes in either patient; instead, lower-amplitude secondary activations are compared between the two methods.

References

    1. Adrian ED. Discharge frequencies in the cerebral and cerebellar cortex. J Physiol. 1935;83:32–33.
    1. Berger H. Über das elektrenkephalogramm des menschen. J Psychol Neurol. 1930;40:160–179.
    1. Brookes MJ, Gibson AM, Hall SD, Furlong PL, Barnes GR, Hillebrand A, Singh KD, Holliday IE, Francis ST, Morris PG. A general linear model for MEG beamformer imaging. NeuroImage. 2004;23:936–946. - PubMed
    1. Brookes MJ, Vrba J, Robinson SE, Stevenson CM, Peters AM, Barnes GR, Hillebrand A, Morris PG. Optimising experimental design for MEG beamformer imaging. NeuroImage. 2007 - PubMed
    1. Brovelli A, Lachaux J-P, Kahane P, Boussaoud D. High gamma frequency oscillatory activity dissociates attention from intention in the human premotor cortex. NeuroImage. 2005;28:154–164. - PubMed

Publication types

MeSH terms

LinkOut - more resources