. 2008 Jun 15;111(12):5745-54.
doi: 10.1182/blood-2007-08-103663. Epub 2008 Mar 20.

Neonatal bone marrow transplantation of ADA-deficient SCID mice results in immunologic reconstitution despite low levels of engraftment and an absence of selective donor T lymphoid expansion

Affiliations

Neonatal bone marrow transplantation of ADA-deficient SCID mice results in immunologic reconstitution despite low levels of engraftment and an absence of selective donor T lymphoid expansion

Denise A Carbonaro et al. Blood. .

Abstract

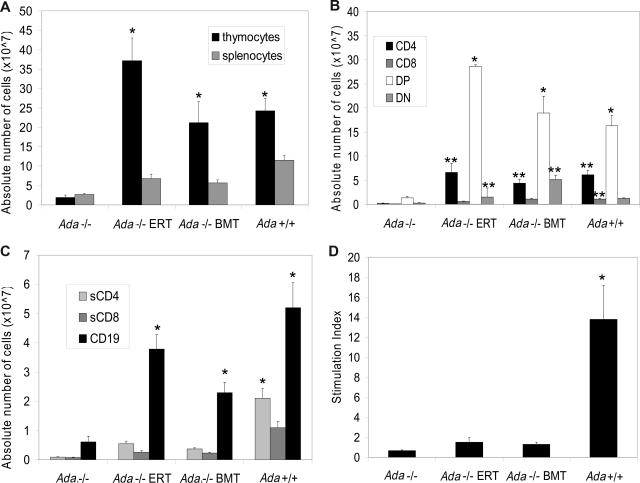
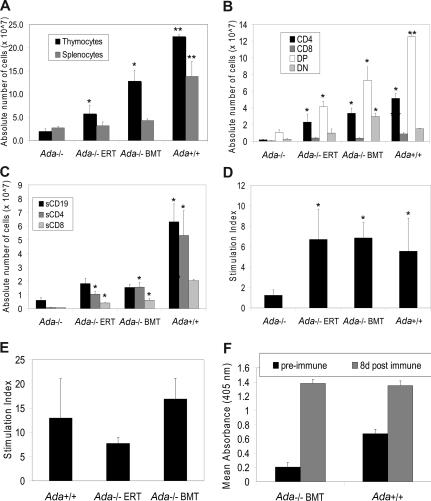
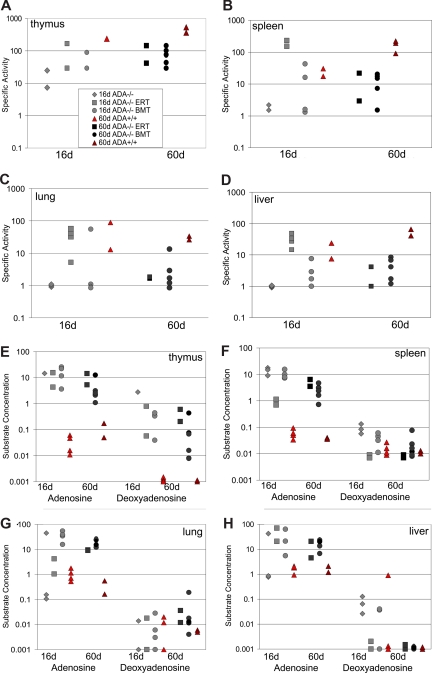
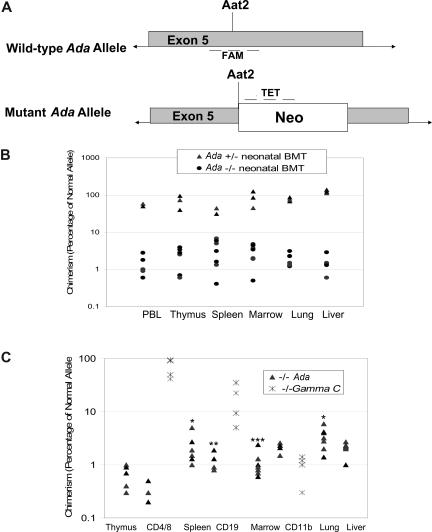
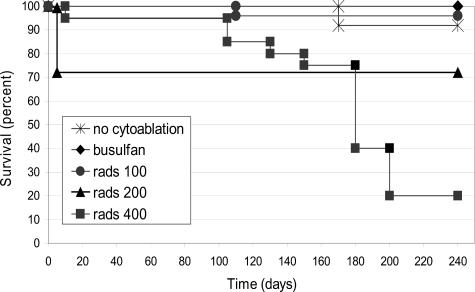
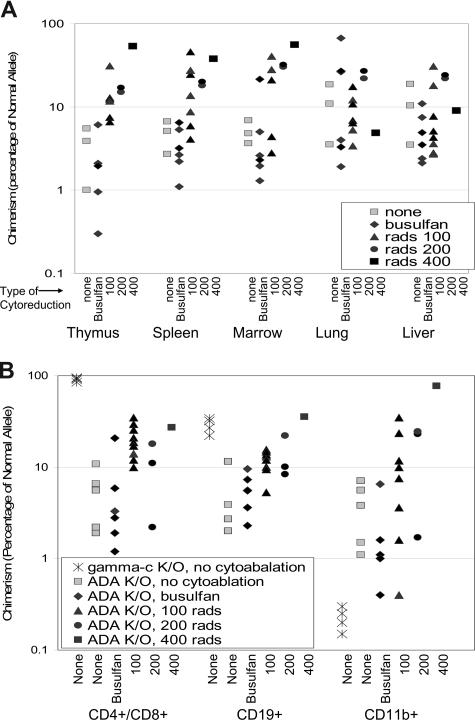
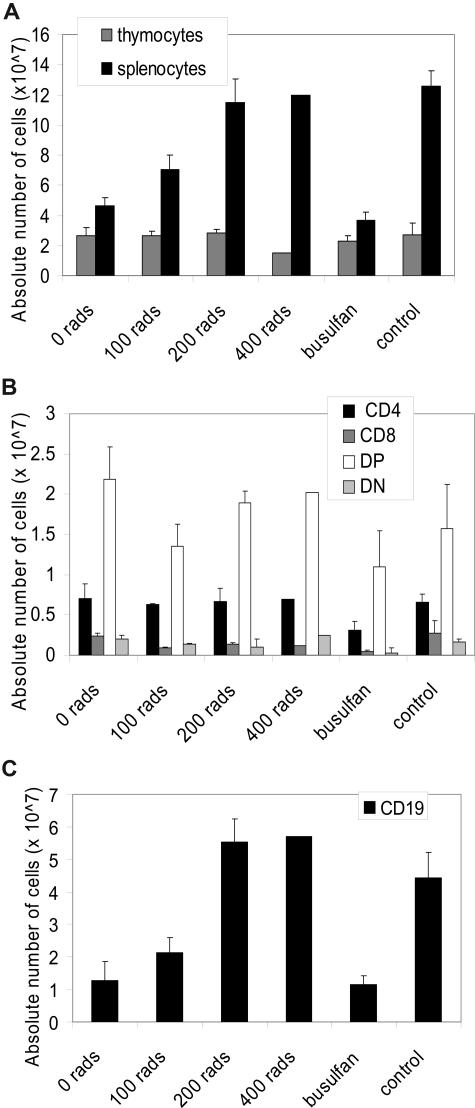
Adenosine deaminase (ADA)-deficient severe combined immune deficiency (SCID) may be treated by allogeneic hematopoietic stem cell transplantation without prior cytoreductive conditioning, although the mechanism of immune reconstitution is unclear. We studied this process in a murine gene knockout model of ADA-deficient SCID. Newborn ADA-deficient pups received transplants of intravenous infusion of normal congenic bone marrow, without prior cytoreductive conditioning, which resulted in long-term survival, multisystem correction, and nearly normal lymphocyte numbers and mitogenic proliferative responses. Only 1% to 3% of lymphocytes and myeloid cells were of donor origin without a selective expansion of donor-derived lymphocytes; immune reconstitution was by endogenous, host-derived ADA-deficient lymphocytes. Preconditioning of neonates with 100 to 400 cGy of total body irradiation before normal donor marrow transplant increased the levels of engrafted donor cells in a radiation dose-dependent manner, but the chimerism levels were similar for lymphoid and myeloid cells. The absence of selective reconstitution by donor T lymphocytes in the ADA-deficient mice indicates that restoration of immune function occurred by rescue of endogenous ADA-deficient lymphocytes through cross-correction from the engrafted ADA-replete donor cells. Thus, ADA-deficient SCID is unique in its responses to nonmyeloablative bone marrow transplantation, which has implications for clinical bone marrow transplantation or gene therapy.


Figures

Figure 1
Figure 1
Immunophenotype and lymphocyte function at 16 days after neonatal BMT. All mice were age-matched (16 days) in the experimental arms: (1) Ada−/− (n = 4), (2) Ada−/− ERT (n = 4), (3) Ada−/− BMT (n = 7), and (4) Ada+/+ (n = 5). *Significantly higher than untreated ADA-deficient mice (P < .001). **Significantly higher than untreated ADA-deficient mice (P < .007). Data are means plus or minus SEM. (A) Absolute numbers of thymocytes and splenocytes. (B) Absolute numbers in each thymocyte subpopulation (CD4+, CD8+, double-positive (DP): CD4+, CD8+, double-negative (DN): CD4, CD8) were calculated by multiplying the total numbers of cells collected from the thymus by the percentage of cells in each subpopulation. (C) Absolute numbers in each splenocyte subpopulation (CD4+, CD8+, CD19+) were calculated by multiplying the total numbers of cells collected from the spleen by the percentage of cells in each subpopulation. (D) Lymphocyte proliferative function was assessed by stimulating splenocytes with concanavalin A (conA) for 48 hours, pulsing with 3H-thymidine for 20 hours, and determining the stimulation index compared with cells not treated with ConA.
Figure 2
Figure 2
Immunophenotype and lymphocyte function at 60 days after neonatal BMT. (A-D) The mice were age-matched (60 days) in the experimental arms: (1) Ada+/+ (n = 4), (2) Ada−/− BMT (n = 6), and (3) Ada−/− ERT (n = 7). Data from the Ada−/− with no treatment (at day 16) from Figure 1 are reproduced here as a historical control. *Significantly higher than untreated ADA-deficient mice (P < .001). **Significantly higher than untreated ADA-deficient mice or those treated with neonatal BMT or ERT (P < .001). Data are means plus or minus SEM. (A) Absolute numbers of thymocytes and splenocytes. (B) Absolute numbers in each thymocyte subpopulation (CD4+, CD8+, double-positive (DP): CD4+, CD8+, double-negative (DN): CD4, CD8). (C) Absolute numbers in each splenocyte subpopulation (CD4+, CD8+, CD19+) were calculated by multiplying the total numbers of cells collected from the organ by the percentage of cells in each subpopulation. (D) Lymphocyte proliferative function to conA was assessed as described in Figure 1. (E) Lymphocyte proliferative function was assessed by stimulating splenocytes with LPS for 48 hours, pulsing with 3H-thymidine for 20 hours, and determining the stimulation index compared with cells not treated with LPS: (1) Ada−/− BMT (n = 5), (2) Ada−/− ERT (n = 2), (3) Ada+/+ (n = 2). (F) IgM production in response to vaccination with Pneumovax 23 in vivo. Preimmune sera were collected before vaccination and compared with sera collected 8 days postvaccination. IgM production was assessed by ELISA. (1) Ada−/− BMT (n = 5), (2) Ada+/+ (n = 3).
Figure 3
Figure 3
ADA specific activity and substrate levels after neonatal BMT. ADA enzyme specific activity (nmol of adenosine converted to inosine/min/mg protein) was determined in tissue lysates. Age-matched, Ada+/+ congenic controls were compared at day 16 (n = 4) and day 60 (n = 2) to untreated Ada−/− mice (n = 3) and Ada−/− treated with neonatal BMT at day 16 (n = 3) and day 60 (n = 6) and to Ada−/− mice receiving ERT with PEG-ADA at day 16 (n = 2) and at day 60 (n = 2). ADA specific activity in the thymus (A), spleen (B), lung (C), and liver (D). ADA substrate concentrations (nmol/mg protein) of adenosine and deoxyadenosine in thymus (E), spleen (F), lung (G), and liver (H).
Figure 4
Figure 4
Determination of donor chimerism after neonatal BMT. (A) Schematic representation of qPCR approach for determining donor chimerism. A real-time quantitative PCR (qPCR) primer/probe set was designed to amplify the normal, wild-type Ada allele at the site of disruption in the mutant allele by insertion of the Neo gene at the unique Aat2 site in exon 5. A second set of primers/probe was designed to the neomycin resistance gene inserted at the Aat2 site in the mutant allele. (B) Chimerism at 16 days after neonatal BMT. Whole litters borne of heterozygous matings were injected with normal donor bone marrow within the first 1 to 3 days after birth; the individual genotypes were subsequently determined from tail DNA. Mice were killed at 16 days of age, and DNA from tissues was analyzed to measure donor chimerism. Both homozygous Ada−/− mice and heterozygous +/− mice were analyzed, with the heterozygote littermates (50% normal allele) serving as internal controls for the qPCR measurements. (C) Chimerism at 60 days after neonatal BMT. In ADA-deficient mice (n = 7), chimerism was determined at day 60 after neonatal BMT, analyzing DNA from tissue fragments as well as from the indicated cell subpopulations isolated with immunomagnetic beads from thymus (CD4+ and CD8+ T cells), spleen (CD19+ B cells), and bone marrow (CD11b+ myeloid cells). γC gene knockout mice (Ly5.1) were treated by neonatal infusion of normal congenic bone marrow (Ly5.2, γC+/+) and killed after 60 days (n = 4). Cells from thymus (CD4+ and CD8+ T cells), spleen (CD19+ B cells), and bone marrow (CD11b+ myeloid cells) were analyzed by flow cytometry to measure donor chimerism, based on the percentage of cells of the indicated cell subpopulations expression Ly5.2. Statistical analysis for Ada−/− only: *Significantly higher than thymus (P < .05), marrow (P < .05), and liver (P < .05). **Significantly higher than CD4 (P < .01). ***Significantly higher than CD19 (P < .006) and CD4 (P < .001).
Figure 5
Figure 5
Survival after neonatal BMT with or without cytoreduction. Survival was recorded after ADA-deficient mice received neonatal BMT without cytoreduction (n = 14) or with cytoreduction using busulfan given to the pregnant dam (n = 21), or by total body irradiation (TBI) of 100 cGy (n = 25), 200 cGy (n = 22), or 400 cGy (n = 20). Survivorship was subjected to Kaplan-Meier analysis and shows a significant dose-response with increasing doses of TBI (P < .001).
Figure 6
Figure 6
Donor chimerism after neonatal BMT and cytoreduction. (A) Chimerism was determined in tissues from ADA-deficient mice (no cytoreduction, n = 3; busulfan, n = 6; 100 cGy, n = 7; 200 cGy, n = 2; and 400 cGy, n = 1) after 240 days as described in Figure 5. Dose-response of chimerism with increasing TBI dosage is significant in thymus (P < .001), spleen (P < .05), and marrow (P < .001). (B) Chimerism was determined in cells from thymus (CD4+ and CD8+ T cells), spleen (CD19+ B cells), and bone marrow (CD11b+ myeloid cells) isolated from ADA-deficient mice (no cytoreduction, n = 5; busulfan, n = 6; 100 cGy, n = 9; 200 cGy, n = 2; and 400 cGy, n = 1) as described in Figure 4B. γC gene knockout mice (Ly5.1) were treated by neonatal infusion of normal congenic bone marrow (Ly5.2, γC+/+) and killed after 200 days (n = 4). Cell populations were isolated and analyzed as described in Figure 4B. Statistical analysis for ADA−/− mice only: Dose-response is significant in CD4+ cells (P < .001), CD19+ cells (P < .001), and CD11b+ cells (P < .05).
Figure 7
Figure 7
Immunophenotype after cytoreduction and neonatal BMT. All mice were age-matched (200-240 days) in the experimental arms: ADA-deficient mice (no cytoreduction, n = 3; 100 cGy, n = 7; 200 cGy, n = 2; and 400 cGy, n = 1; busulfan, n = 6) after 240 days. (A) Absolute numbers of thymocytes and splenocytes. Data are means plus or minus SEM. Significant dose-response in splenocytes (P < .001). (B) Absolute numbers in each thymocyte subpopulation (CD4+, CD8+, double-positive (DP): CD4+, CD8+, double-negative (DN): CD4, CD8) were calculated by multiplying the total numbers of cells collected from the thymus by the percentage of cells in each subpopulation. (C) Absolute numbers in each splenocyte subpopulation (CD4+, CD8+, CD19+) were calculated by multiplying the total numbers of cells collected from the spleen by the percentage of cells in each subpopulation. Significant dose-response in CD19+ (P < .001).

References

    1. Hershfield M S, Mitchell B S. Immunodeficiency diseases caused by adenosine deaminase deficiency and purine nucleoside phosphorylase deficiency. In: Scriver CR, Beaudet AL, Sly WS, Valle D, editors. Metabolic and Molecular Bases of Inherited Disease. 8th ed. New York, NY: McGraw-Hill; 2001. pp. 2585–2625.
    1. Small T N, Freidrich W, O'Reilly R J. Hematopoietic stem cell transplantation for immunodeficiency diseases. In: Blume KC, Forman SJ, Appelbaum FR, editors. Hematopoietic Stem Cell Transplantation. 3rd ed. Malden, MA: Blackwell Science; 2004. pp. 1430–1442.
    1. Buckley RH, Schiff SE, Schiff RI, et al. Hematopoietic stem-cell transplantation for the treatment of severe combined immunodeficiency. N Engl J Med. 1999;340:508–516. - PubMed
    1. van Leeuwen JE, van Tol MJ, Joosten AM, et al. Relationship between patterns of engraftment in peripheral blood and immune reconstitution after allogeneic bone marrow transplantation for (severe) combined immunodeficiency. Blood. 1994;84:3936–3947. - PubMed
    1. Tjonnfjord GE, Steen R, Veiby OP, Friedrich W, Egeland T. Evidence for engraftment of donor-type multipotent CD34+ cells in a patient with selective T-lymphocyte reconstitution after bone marrow transplantation for B-SCID. Blood. 1994;84:3584–3589. - PubMed

Publication types

MeSH terms

Substances