. 2008 Apr;118(4):1390-7.
doi: 10.1172/JCI34388.

Two-photon imaging of intratumoral CD8+ T cell cytotoxic activity during adoptive T cell therapy in mice

Affiliations

Two-photon imaging of intratumoral CD8+ T cell cytotoxic activity during adoptive T cell therapy in mice

Béatrice Breart et al. J Clin Invest. 2008 Apr.

Abstract

CTLs have the potential to attack tumors, and adoptive transfer of CTLs can lead to tumor regression in mouse models and human clinical settings. However, the dynamics of tumor cell elimination during efficient T cell therapy is unknown, and it is unclear whether CTLs act directly by destroying tumor cells or indirectly by initiating the recruitment of innate immune cells that mediate tumor damage. To address these questions, we report real-time imaging of tumor cell apoptosis in vivo using intravital 2-photon microscopy and a Förster resonance energy transfer-based (FRET-based) reporter of caspase 3 activity. In a mouse model of solid tumor, we found that tumor regression after transfer of in vitro-activated CTLs occurred primarily through the direct action of CTLs on each individual tumor cell, with a minimal bystander effect. Surprisingly, the killing of 1 target cell by an individual CTL took an extended period of time, 6 hours on average, which suggested that the slow rate of killing intrinsically limits the efficiency of antitumor T cell responses. The ability to visualize when, where, and how tumor cells are killed in vivo offers new perspectives for understanding how immune effectors survey cancer cells and how local tumor microenvironments may subvert immune responses.


Figures
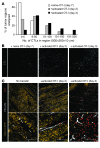
Figure 2
Figure 2. Visualization of intratumoral CTL dissemination during adoptive T cell therapy.
(A and B) In vitro, but not in vivo, primed CTLs massively infiltrated the EG7 tumors. The distribution of intratumoral CTLs (white) was visualized and quantified on frozen sections of EG7 tumor after adoptive transfer of naive or in vitro activated OT-I CD8+ T cells. (A) CTLs were counted in multiple individual areas of the tumor encompassing a fixed volume of 500 × 500 × 10 μm. The percentage of tumor areas containing the indicated number of CTLs is shown. The response mounted by in vivo primed OT-I CD8+ T cells resulted in a lower and less homogenous CTL infiltrate than did that mounted by in vitro activated CD8+ T cells at all time points analyzed. (B) Representative images showing CTL infiltration after transfer of naive or activated OT-I CD8+ T cells. (C) Dissemination of in vitro primed CTLs occurred concomitantly with tumor cell elimination. Two days after adoptive transfer of in vitro activated OT-I CD8+ T cells, CTLs (red) accumulated in the vicinity of tumor microvessels (white, stained for PECAM). On day 3, CTLs were more evenly distributed, and many EG7 tumor cells had been eliminated. Note that CTL-rich areas tend to have a lower density of EG7 tumor cells (yellow). Scale bars: 100 μm.
Figure 1
Figure 1. Antigen-specific tumor regression upon adoptive transfer of in vitro primed CTLs.
C57BL/6 mice were injected s.c. with 2 × 10⁶ EL4 tumor cells or with the OVA-expressing variant EG7 expressing mCFP or mYFP, respectively. On day 5, mice were adoptively transferred with 5 × 10⁶ OT-I CD8+ T cells that were activated in vitro for 48 hours. A second group of recipient mice were adoptively transferred with 5 × 10⁶ naive OT-I CD8+ T cells. Naive OT-I CD8+ T cells were transferred on day 3 to allow additional time for in vivo activation. (A) Tumor growth was followed over time. In vitro, but not in vivo, primed OT-I CD8+ T cells induced complete regression of EG7 tumors. (B) Confocal images of tumor frozen sections 5–7 days following adoptive transfer of naive or in vitro activated OT-I T cells. Most EG7-mYFP tumor cells were rapidly eliminated after transfer of activated OT-I CD8+ T cells but not after transfer of naive OT-I CD8+ T cells. Scale bars: 100 μm.
Figure 3
Figure 3. Direct action of CTLs on individual tumor cells drives tumor regression.
Mice were injected with a mixture of EL4-mCFP and EG7-mYFP tumor cells. On day 5, some mice were adoptively transferred with 5 × 10⁶ in vitro activated OT-I CD8+ T cells. Three days after transfer, tumors were harvested, and confocal imaging was performed on frozen sections. (A) Mice injected with the tumor cell mixture developed chimeric tumors composed of small individual patches of EL4-mCFP and EG7-mYFP cells (left). The transfer of OT-I CTLs resulted in the clearance of EG7-mYFP patches, whereas EL4-mCFP patches appeared minimally affected (middle and right). Scale bars: 100 μm (left and middle); 10 μm (right). (B) The contribution of EG7-mYFP, EL4-mCFP, or other cells (i.e., nonfluorescent cells) to the overall tumor volume was determined from confocal images of frozen tumor sections. Each dot represents the value derived from an individual section. (C) Single-cell suspensions of tumor were analyzed by flow cytometry. The relative percentage of EG7-mYFP and EL4-mCFP cells is shown. Data are gated on tumor cells.
Figure 4
Figure 4. A fluorescent probe to track tumor cell apoptosis.
(A) EG7 tumor cells were stably transfected with a FRET-based fluorescent probe monitoring caspase 3 activity. Briefly, CFP and YFP molecules are linked by a peptide containing the sequence DEVD, which is cleaved by activated caspase 3. EG7 cells were also transfected with a control probe (noncleavable by caspase 3) bearing a mutation in the cleavage motif (DEVG). Cleavage of the probe upon caspase 3 activation resulted in FRET disruption. Tumor cell apoptosis was monitored by 2-photon imaging by calculating the ratio of CFP to YFP emission (for the sake of clarity, this is referred to as the apoptosis index). (B and C) EG7-DEVG or EG7-DEVD tumor cells were subjected to UVB irradiation for 1 minute. Eight hours later, cells were visualized by 2-photon imaging. UVB irradiation resulted in FRET disruption in EG7-DEVD but not in control EG7-DEVG tumors cells. Scale bars: 10 μm. The apoptosis index plotted for individual tumor cells is shown. Tumor cells with a ratio greater than 1.7 were considered to be undergoing apoptosis. (D and E) Flow cytometric analysis of FRET loss in EG7-DEVD and EG7-DEVG tumor cells subjected to UVB irradiation or cocultured with activated OT-I CTLs for 5 hours. The population of EG7 tumor cells displaying FRET loss is shown in green, and the corresponding percentage is indicated.
Figure 5
Figure 5. Dynamics of CTL-mediated tumor cell apoptosis in vivo.
(A) Intravital 2-photon imaging of mice bearing EG7-DEVD tumors and transferred with activated GFP-expressing OT-I CTLs showed a close juxtaposition of CTLs (pseudocolored in red) and apoptotic tumor cells (green). (B) The apoptosis index (reflecting FRET disruption) was calculated for individual tumor cells together with the number of CTLs in contact. The percentage of tumor cells undergoing apoptosis is shown. (C) The apoptosis index of individual tumor cells was tracked over time. Representative tumor cells with a constant low (live→live), a high (apoptotic→apoptotic), or an increasing (live→apoptotic) apoptosis index are shown. (D) Examples of tumor cells undergoing apoptosis while establishing interaction with CTLs. (E) Tumor cells initiated apoptosis during interactions with CTLs. Individual tumor cells were divided into 3 categories on the basis of the evolution of their apoptosis index over time. The percentage of tumor cells engaged by CTLs is shown for each category. (F) The killing of 1 tumor cell by an individual CTL took an average of 6 hours. A total of 129 individual stable interactions between a CTL and a live tumor cell were recorded (for an average of 35 minutes each), which represented a cumulative time of imaging of 74 hours and 41 minutes. The number of killing events (as detected by FRET loss in individual tumor cells) was expressed as a function of the elapsed cumulative time of imaging. The rate of cell killing was estimated to be 1 tumor cell every 6 hours per CTL.
Figure 6
Figure 6. In vivo primed CTLs failed to control tumor growth despite exhibiting effective cytotoxic activity at the tumor site.
(A) Naive OT-I CD8+ T cells (5 × 10⁶ cells) were adoptively transferred 3 days after the mice were injected with a mixture of EL4-mCFP and EG7-mYFP tumor cells. Representative confocal images of tumor sections indicate a distinct level of CTL infiltration. EG7 tumor cells were eliminated in the CTL-rich area, which indicated in situ cytotoxic activity (right). Little to no EG7 killing was detected in regions of the tumor with little CTL infiltration (left). Scale bars: 100 μm. (B) Naive OT-I CD8+ T cells were adoptively transferred in mice injected with EG7-DEVD tumor cells. Representative images indicate that in vivo primed CTLs (red) were closely associated with apoptotic tumor cells (green).

References

    1. Zou W. Immunosuppressive networks in the tumour environment and their therapeutic relevance. Nat. Rev. Cancer. 2005;5:263–274. doi: 10.1038/nrc1586. - DOI - PubMed
    1. Gattinoni L., Powell D.J., Jr., Rosenberg S.A., Restifo N.P. Adoptive immunotherapy for cancer: building on success. Nat. Rev. Immunol. 2006;6:383–393. doi: 10.1038/nri1842. - DOI - PMC - PubMed
    1. Dudley M.E., et al. Cancer regression and autoimmunity in patients after clonal repopulation with antitumor lymphocytes. Science. 2002;298:850–854. doi: 10.1126/science.1076514. - DOI - PMC - PubMed
    1. Morgan R.A., et al. Cancer regression in patients after transfer of genetically engineered lymphocytes. Science. 2006;314:126–129. doi: 10.1126/science.1129003. - DOI - PMC - PubMed
    1. Kagi D., et al. Cytotoxicity mediated by T cells and natural killer cells is greatly impaired in perforin-deficient mice. Nature. 1994;369:31–37. doi: 10.1038/369031a0. - DOI - PubMed

Publication types