

Kinetics and activation energy of recrystallization of intracellular ice in mouse oocytes subjected to interrupted rapid cooling
- PMID: 18359013
- PMCID: PMC2705660
- DOI: 10.1016/j.cryobiol.2008.02.001
Kinetics and activation energy of recrystallization of intracellular ice in mouse oocytes subjected to interrupted rapid cooling
Abstract
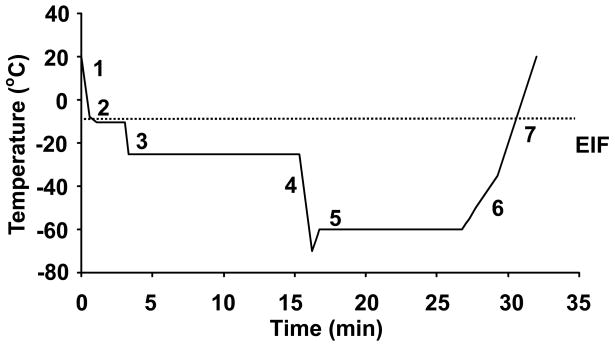
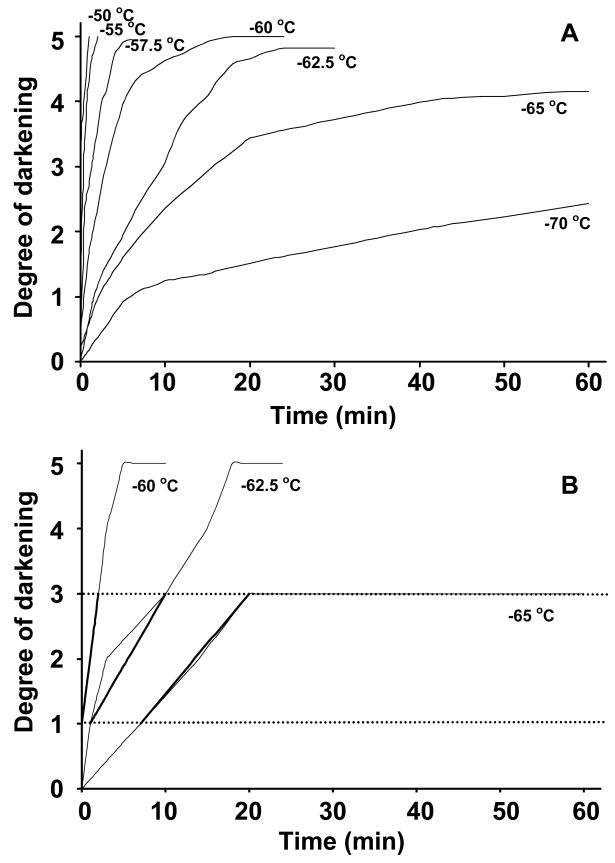
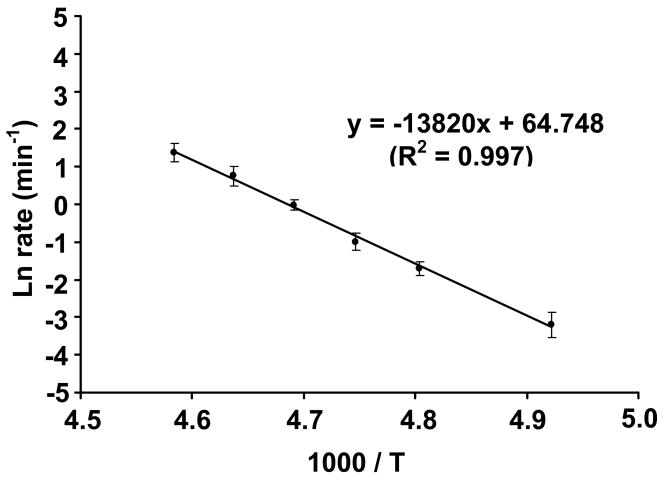
Intracellular ice formation (IIF) is almost invariably lethal. In most cases, it results from the too rapid cooling of cells to below -40 degrees C, but in some cases it is manifested, not during cooling, but during warming when cell water that vitrified during cooling first devitrifies and then recrystallizes during warming. Recently, Mazur et al. [P. Mazur, I.L. Pinn, F.W. Kleinhans, Intracellular ice formation in mouse oocytes subjected to interrupted rapid cooling, Cryobiology 55 (2007) 158-166] dealt with one such case in mouse oocytes. It involved rapidly cooling the oocytes to -25 degrees C, holding them 10 min, rapidly cooling them to -70 degrees C, and warming them slowly until thawed. No IIF occurred during cooling but intracellular freezing, as evidenced by blackening of the cells, became detectable at -56 degrees C during warming and was complete by -46 degrees C. The present study differs in that the oocytes were warmed rapidly from -70 degrees C to temperatures between -65 and -50 degrees C and held for 3-60 min. This permitted us to determine the rate of blackening as function of temperature. That in turn allowed us to calculate the activation energy (E(a)) for the blackening process; namely, 27.5 kcal/mol. This translates to about a quadrupling of the blackening rate for every 5 degrees C rise in temperature. These data then allowed us to compute the degree of blackening as a function of temperature for oocytes warmed at rates ranging from 10 to 10,000 degrees C/min. A 10-fold increase in warming rate increased the temperature at which a given degree of blackening occurred by 8 degrees C. These findings have significant implications both for cryobiology and cryo-electron microscopy.
Figures


References
-
- Fahy GM. Biological effects of vitrification and devitrification. In: Pegg DE, Karow AM Jr, editors. The Biophysics of Organ Cryopreservation. Plenum Press; NY: 1987. pp. 265–297.
-
- Fahy GM. Vitrification. In: Diller KR, McGrath JJ, editors. Emerging Applications and Engineering Contributions. Amer. Soc. Mechanical Engineers; NY: 1988.
-
- Hayes AR, Pegg DE. Physical data relevant to the use of ethane-1,2-diol (ethylene glycol) as a cryoprotectant. Cryo-Letters. 1996;17:249–256.
-
- Karlsson JOM. A theoretical model of intracellular devitrification. Cryobiology. 2001;41:154–169. - PubMed
-
- Kingery WD. Regelation, surface diffusion, and ice sintering. J Applied Physics. 1960;31:833–838.
MeSH terms
Substances
Grants and funding
LinkOut - more resources
Full Text Sources
