. 2008 May 16;283(20):13806-16.
doi: 10.1074/jbc.M800247200. Epub 2008 Mar 21.

Nucleation-dependent tau filament formation: the importance of dimerization and an estimation of elementary rate constants

Affiliations

Nucleation-dependent tau filament formation: the importance of dimerization and an estimation of elementary rate constants

Erin E Congdon et al. J Biol Chem. .

Abstract

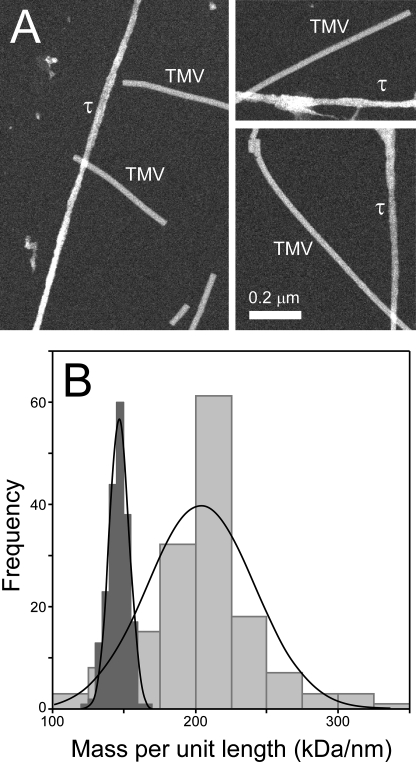
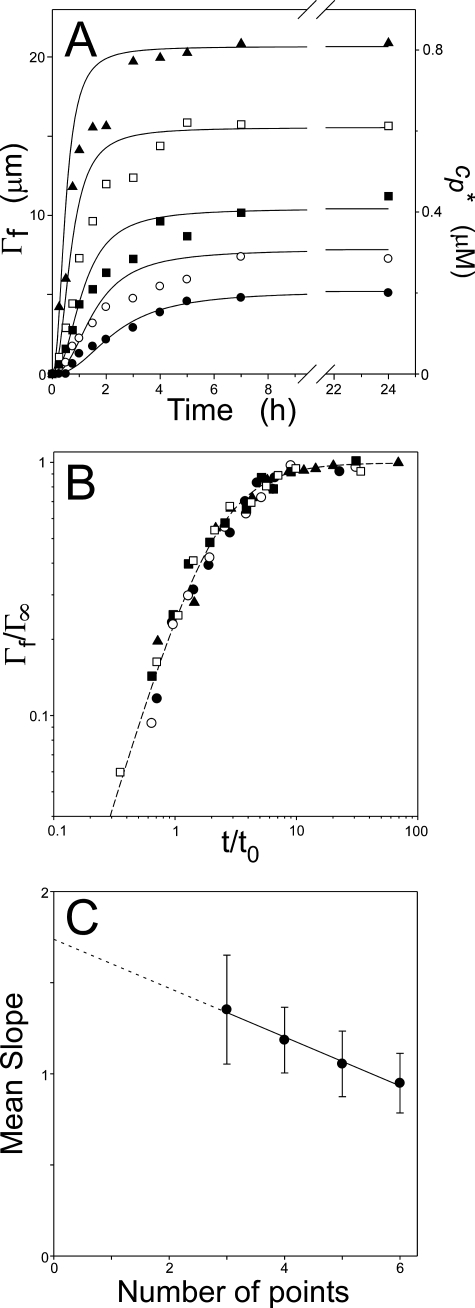
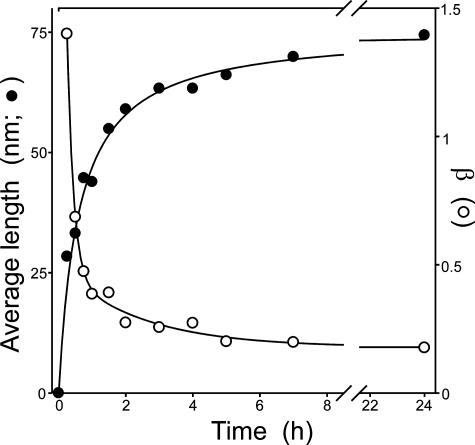
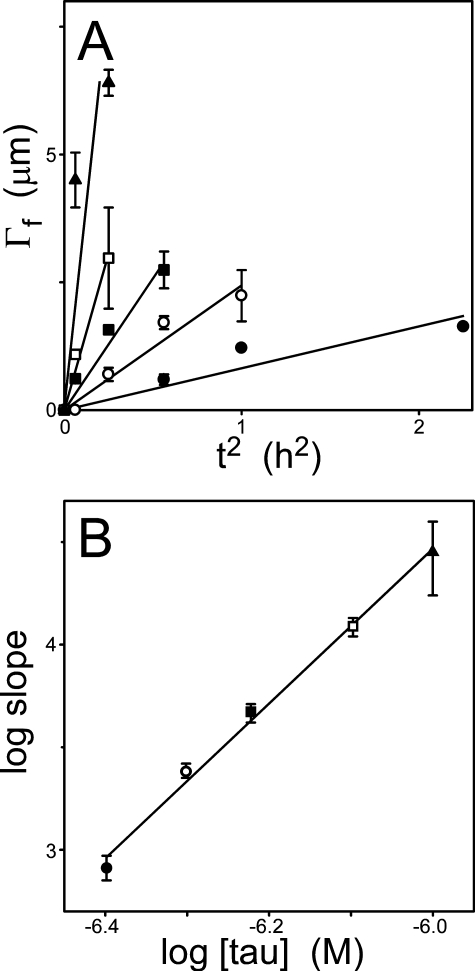
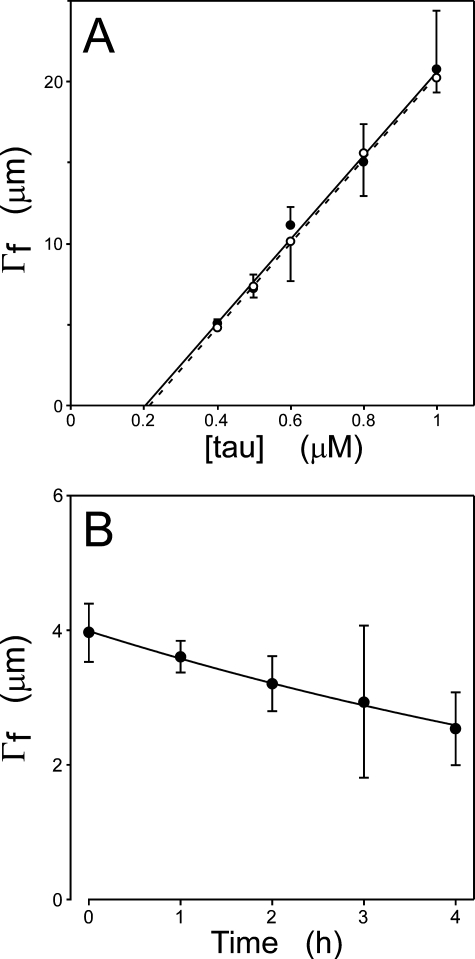
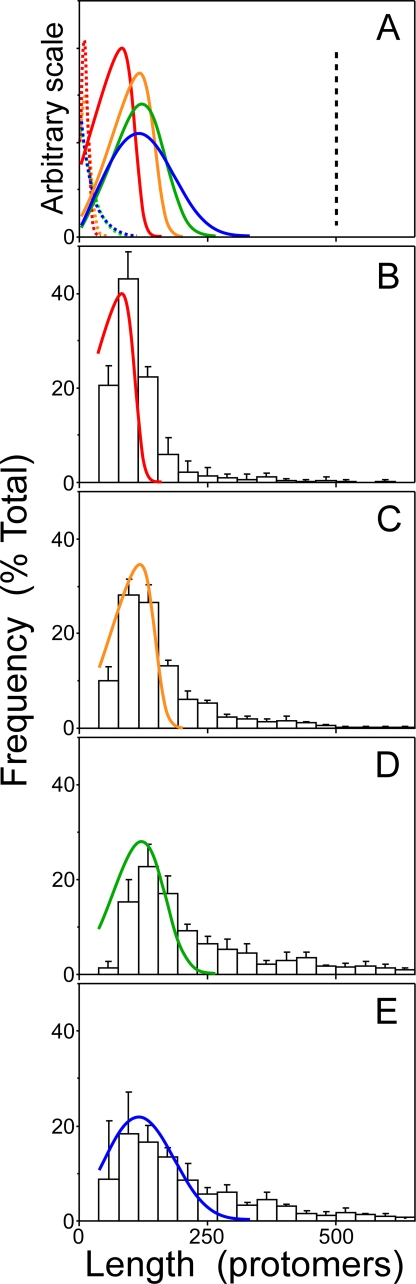
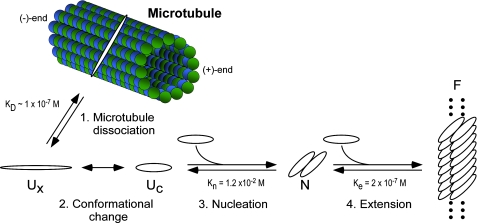
Filamentous inclusions composed of the microtubule-associated protein tau are found in Alzheimer disease and other tauopathic neurodegenerative diseases, but the mechanisms underlying their formation from full-length protein monomer under physiological conditions are unclear. To address this issue, the fibrillization of recombinant full-length four-repeat human tau was examined in vitro as a function of time and submicromolar tau concentrations using electron microscopy assay methods and a small-molecule inducer of aggregation, thiazine red. Data were then fit to a simple homogeneous nucleation model with rate constant constraints established from filament dissociation rate, critical concentration, and mass-per-unit length measurements. The model was then tested by comparing the predicted time-dependent evolution of length distributions to experimental data. Results indicated that once assembly-competent conformations were attained, the rate-limiting step in the fibrillization pathway was tau dimer formation. Filament elongation then proceeded by addition of tau monomers to nascent filament ends. Filaments isolated at reaction plateau contained approximately 2 tau protomers/beta-strand spacing on the basis of mass-per-unit length measurements. The model suggests four key steps in the aggregation pathway that must be surmounted for tau filaments to form in disease.


Figures

FIGURE 1.
FIGURE 1.
STEM analysis. htau40 (8 μm) was incubated in assembly buffer without agitation in the presence of 100 μm thiazine red for 24 h at 37 °C. Samples were then gel-filtered, flash-frozen, and subjected to STEM analysis along with TMV standard as described under “Experimental Procedures.” A, STEM images from which mass-per-unit length measurements were made. B, histograms relating frequency to mass-per-unit length for tau filaments (151 observations; light graybars) and TMV (200 observations; dark gray bars). Raw average mass-per-unit length values for tau filaments (205 ± 38 kDa/nm) and TMV (145 ± 7 kDa/nm) were estimated assuming Gaussian distributions (solid lines).
FIGURE 2.
FIGURE 2.
Time dependence of thiazine red-mediated tau fibrillization. A, recombinant full-length human tau (•, 0.4 μm; ○, 0.5 μm; ▪, 0.6 μm; □, 0.8 μm; ▴, 1 μm) was incubated at 37 °C in the presence of 100 μm thiazine red inducer, with aliquots removed and assayed for filament formation by electron microscopy. Each point represents the total length of all filaments per field (Γf) averaged from three negatives at the indicated incubation time, whereas the solid lines represent the best fit of all time series to an equilibrium nucleation model constrained so that n = 2, ke+ = 9.5 × 10⁴ m-1 s-1, and ke- = 0.019 s-1 (see “Results” for details). B, demonstration of data collapse. The data from panel A were replotted with normalized axes Γf versus t/t0, as described previously (21), except that the characteristic time, t0, corresponded to the time when each series was 37% complete. C, the number of intermediate assembly stages of the nucleus, k, was estimated from the initial slopes of each time series shown in panel B by fitting the first 3–6 data points of each time series to a linear regression, then replotting the average slope of those lines (±S.E. of the estimate) against the number of data points examined (19). The solid line represents best fit of the data points to a linear regression, which was extrapolated to zero to yield 1.73 ± 0.19 as an estimate of k + 2. Therefore, k ∼ 0.
FIGURE 3.
FIGURE 3.
Filament length distributions. Average filament length (•) and β (the log-linear slope of the length distribution above the mode) (○) were determined for each time point in the 1 μm htau40 time series. Average length increased in a time-dependent manner with a concurrent decrease in β. The pattern is consistent with an equilibrium nucleation reaction but not secondary nucleation along filament lengths.
FIGURE 4.
FIGURE 4.
The tau nucleus is a dimer. A, the time series from Fig. 2A was replotted as a function of t2. Each data point represents total filament length per field ±S.D. for the initial points of the time series, whereas each line represents best fit of the data points to a linear regression constrained to pass through the origin. B, the resultant slopes (±S.E. of the estimate) were then replotted as a function of bulk tau concentration in double-log format. The slope of this replot (3.8 ± 0.2) was taken as an estimate of n + 2, where n represents nucleus cluster size. The tau nucleus approximates a dimer.
FIGURE 5.
FIGURE 5.
Estimation of Kcrit and ke-. A, plateau filament lengths from Fig. 2A were replotted as a function of bulk tau concentrations at 7 (○) and 24 h (•). Each data point represents total filament length per field ± S.D. (n = 3 observations), whereas each line (dashed, 7 h; solid, 24 h) represents linear regression of the data points. Kcrit was estimated from the abscissa intercept of each regression line. B, tau filaments were prepared (1.6 μm htau40, 24 h at 37 °C), then diluted 10-fold into assembly buffer containing thiazine red. The resultant disaggregation was followed as a function of time by electron microscopy. Each data point represents total filament length per field ± S.D. (n = 3 observations), whereas the solid line represents best fit of the data points to an exponential decay function. The first order decay constant, kapp, was estimated as 3.0 ± 0.1 × 10⁻⁵ s-1.
FIGURE 6.
FIGURE 6.
Tau filament length distributions. The time-dependent evolution of length distribution was calculated for 1 μm tau from the parameters in Table 1 in conjunction with Equations 8, 9, 10, 11, 12 (N = 500) as described under “Experimental Procedures.” A, two-dimensional slices through resultant time courses at 0.5 (red), 1 (orange), 7 (green), and 24 h (blue) are plotted, where each line represents relative frequency of filament length in units of protomers. For a nucleation-dependent mechanism where n = 2, calculated length distributions predicted rapid formation of a stable peaked distribution followed by monotonously decreasing relative mode height as a function of time (solid lines). Adjusting n above or below a value of 2 greatly modified the simulation. For example, under isodesmic conditions (no nucleation step, ke- = 0.019 s-1, ke+ = 106 m-1 s-1), length distributions shifted toward shorter lengths, so that no filament exceeded a length of 100 protomers (dotted lines). In contrast, increasing n to 3 (while using nucleation and elongation constants from Table 1) shifted the distribution so that all filaments aligned at the top limit of the calculated distribution range (N = 500), indicating that all filaments were at least 500 protomers in length at all time points between 0.5–24 h (shown as a single dashed line). The simulations predict that length distribution reflects aggregation mechanism. B–E, lengths of filaments >10 nm formed as function of time (B, 0.5 h; C, 1 h; D, 7 h; E, 24 h) from 1 μm tau were measured and segregated into 10-nm bins. The relative frequency of each bin relative to the total number of filaments in the sample was then calculated and superimposed on slices prepared from the calculated length distributions shown for n = 2 in panel A above. The calculated length distribution for this condition approximates experiment-derived mode and distribution skew.
FIGURE 7.
FIGURE 7.
Hypothetical model of tau fibrillization in disease. Normal tau binds tightly to microtubules but dissociates upon phosphorylation to form free tau, which exists as a natively disordered, assembly incompetent monomer (Ux). A conformational change to an assembly competent state accelerates polymerization (Uc). Once assembly-competent species form, the rate-limiting step in tau fibrillization is the formation of dimer, which represents the thermodynamic nucleus (N). After nucleation, extension occurs through further addition of assembly competent monomers to the filament (F) ends. See “Discussion” for details.

References

    1. Dehmelt, L., and Halpain, S. (2005) Genome Biology 6 204. - PMC - PubMed
    1. Lee, V. M., Goedert, M., and Trojanowski, J. Q. (2001) Annu. Rev. Neurosci. 24 1121-1159 - PubMed
    1. Barghorn, S., Davies, P., and Mandelkow, E. (2004) Biochemistry 43 1694-1703 - PubMed
    1. Berriman, J., Serpell, L. C., Oberg, K. A., Fink, A. L., Goedert, M., and Crowther, R. A. (2003) Proc. Natl. Acad. Sci. U. S. A. 100 9034-9038 - PMC - PubMed
    1. Margittai, M., and Langen, R. (2004) Proc. Natl. Acad. Sci. U. S. A. 101 10278-10283 - PMC - PubMed

Publication types

LinkOut - more resources