. 2008 Dec;18(12):2775-88.
doi: 10.1093/cercor/bhn036. Epub 2008 Mar 20.

Motor planning, imagery, and execution in the distributed motor network: a time-course study with functional MRI

Affiliations

Motor planning, imagery, and execution in the distributed motor network: a time-course study with functional MRI

Takashi Hanakawa et al. Cereb Cortex. 2008 Dec.

Abstract

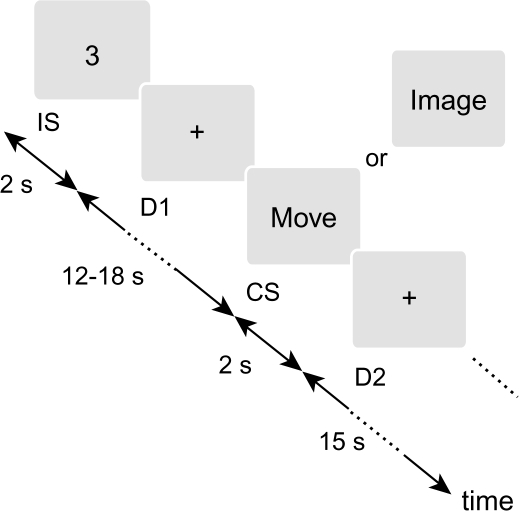
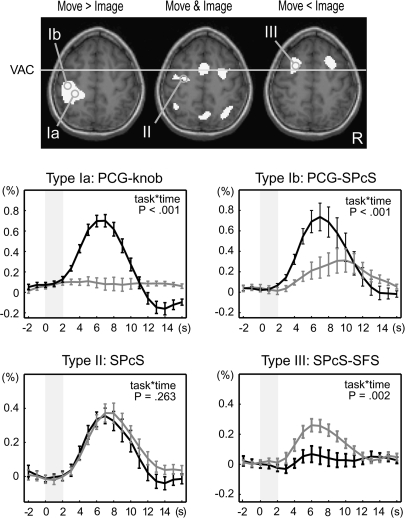
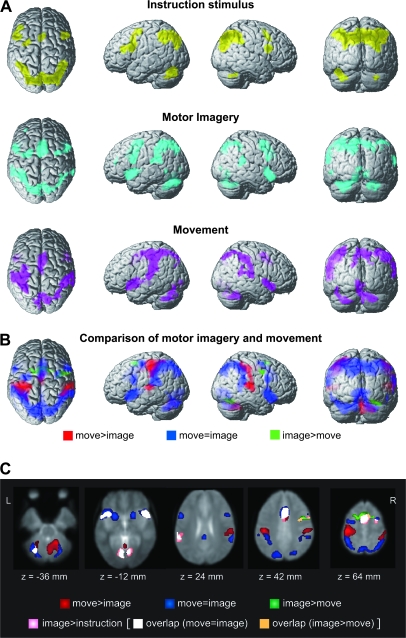
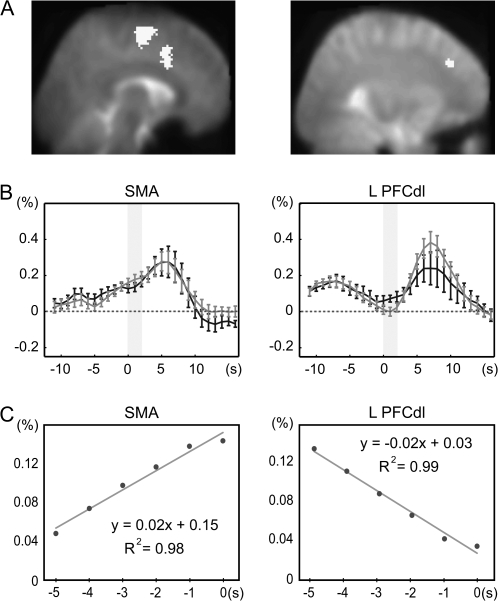
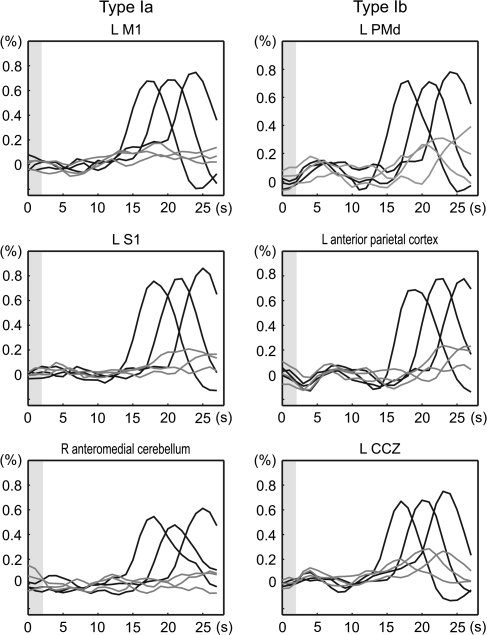
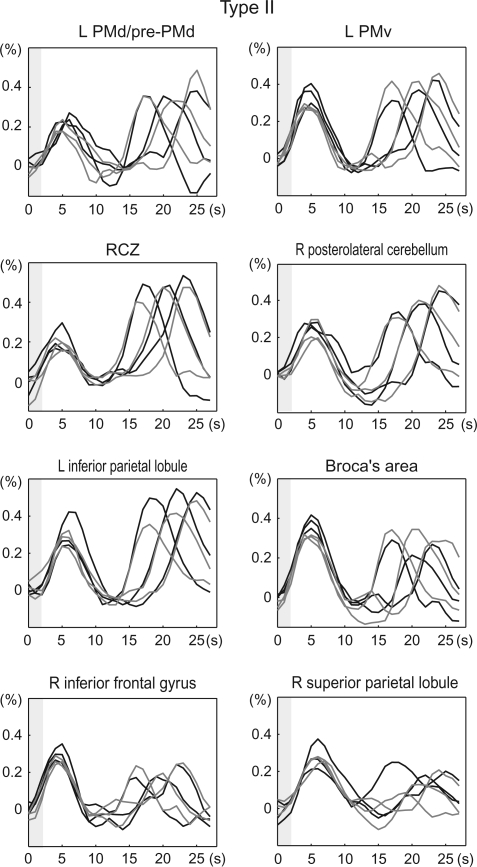
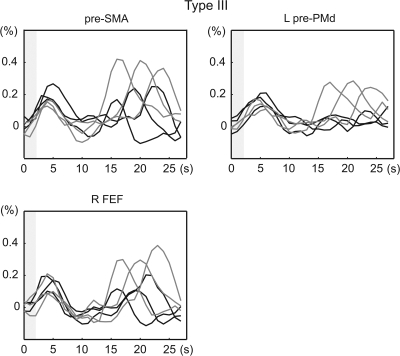
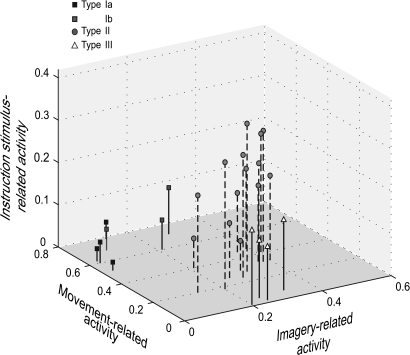
Activation of motor-related areas has consistently been found during various motor imagery tasks and is regarded as the central mechanism generating motor imagery. However, the extent to which motor execution and imagery share neural substrates remains controversial. We examined brain activity during preparation for and execution of physical or mental finger tapping. During a functional magnetic resonance imaging at 3 T, 13 healthy volunteers performed an instructed delay finger-tapping task either in a physical mode or mental mode. Number stimuli instructed subjects about a finger-tapping sequence. After an instructed delay period, cue stimuli prompted them either to execute the tapping movement or to imagine it. Two types of planning/preparatory activity common for movement and imagery were found: instruction stimulus-related activity represented widely in multiple motor-related areas and delay period activity in the medial frontal areas. Although brain activity during movement execution and imagery was largely shared in the distributed motor network, imagery-related activity was in general more closely related to instruction-related activity than to the motor execution-related activity. Specifically, activity in the medial superior frontal gyrus, anterior cingulate cortex, precentral sulcus, supramarginal gyrus, fusiform gyrus, and posterolateral cerebellum likely reflects willed generation of virtual motor commands and analysis of virtual sensory signals.


Figures

Figure 1.
Figure 1.
dSMI task. Subjects were asked to remember the instruction stimuli (IS), which were presented for 2 s and specified a segment of the learned finger-tapping sequence. During a variable delay period (D1) for 12–18 s, subjects waited for the presentation of a cue stimulus (CS), which were presented for 2 s and specified a mode of performance, actual movement, or motor imagery. When the word “MOVE” was presented, subjects pressed buttons corresponding to the instructed tapping sequence. When the word “IMAGE” was presented, subjects imagined the same movement as being performed by them. Subjects were required to keep track of the tapping sequence continuously throughout a single experimental run. During a 2nd delay period (D2) for 15 s, subjects therefore remembered the finger from which they would resume tapping for the next set of stimuli.
Figure 2.
Figure 2.
Classification of cue stimulus–related activity for time-course analysis. Cue stimulus–related activity was classified into 3 types: type I showing movement-predominant activity, type II showing cue stimulus–related activity similarly for movement and imagery events, and type III showing imagery-predominant activity. Activation maps from a representative subject (P < 0.001, uncorrected) were overlain onto an axial slice (z = 56 mm) of the individual's own anatomical image. Gray circles are examples of the sampled VOIs including the “hand knob” of the precentral gyrus (PCG-knob, Ia), rostrolateral part of the PCG juxtaposed to the superior precentral sulcus (PCG-SPcS, Ib), SPcS (SPcS, II), and SPcS extending into a posterior part of the superior frontal sulcus (SPcS-SFS, III). Time-course data were sampled from predetermined sets of areas according to each individual's anatomy and activation maps as such. Signal changes from VOIs were aligned to the cue stimulus onset (time 0), converted into percent signal changes, and averaged across subjects. Type I activity was further divided into 2 subtypes: type Ia (e.g., PCG-knob) showing clear movement-related activity (black) with almost no imagery-related activity (gray) and type Ib (e.g., PCG-SPcS) showing salient movement-related activity with modest (ca. 0.3%) imagery-related activity. Activity in the SPcS (type II) and the SPcS-SFS (type III) is shown in the same format. P values indicate task-by-time interaction by repeated-measures ANOVA, and the error bars indicate standard errors of mean. The x-axis represents time in seconds after the cue stimulus onset, and the y-axis represent percent signal changes. Gray shades indicate the period of time during which the cue stimuli were presented.
Figure 3.
Figure 3.
Statistical parametric maps of event-related activity. (A) IS-related activity (yellow) was observed bilaterally in the frontoparietal areas and cerebellum. Motor imagery-related activity (cyan) was seen in the similar frontoparietal areas, with greater emphasis on the supplementary motor areas, ventral and dorsal premotor areas, frontal and temporal opercular areas, inferior parietal areas, and cerebellum. Movement-related activity (magenta) was marked in the left central areas in addition to the frontoparietal areas. For a display purpose, the activity was theresholded at P < 0.001 (uncorrected), and clusters with more than 50 voxles are surface rendered onto a standard brain. (B) The comparison of movement-related and imagery-related activities. Movement-predominant activity (red) was found in the left central area, bilateral parietotemporal junctions, and right anterior cerebellum. Imagery-predominant activity (green) was found in the left superior frontal sulcus, bilateral superior precentral sulcus, medial aspects of the superior frontal gyrus, and right occipital cortex. The common movement-and-imagery activity (blue) from a conjunction analysis was widely distributed in the frontoparietal areas, occipital cortex, and cerebellum. (C) Imagery-related activity greater than the IS-related activity (pink) was observed in the right posterolateral cerebellum (z = −36 mm), bilateral frontal and temporal opercular areas and fusiform gyri (z = −12 mm), left supramarginal gyrus (z = 24 mm), anterior cingulate cortex and right precentral sulcus (z = 42 mm), and medial superior frontal gyrus (z = 64 mm). This activity mostly overlapped with the common movement-and-imagery activity (overlap in white) and slightly with imagery-predominant activity in the right precentral sulcus (overlap in orange). The other part of the movement-and-imagery activity (blue), imagery-predominant (green), and movement-predominant (red) activities are shown for reference. Activity is overlain onto the PRESTO template image.
Figure 4.
Figure 4.
D1 delay period activity. (A) Delay period activity (activity greater during the 1st delay periods than during the 2nd delay periods) in the supplementary motor areas (SMAs) from the 2nd-stage analysis, superimposed onto a sagittal slice of the PRESTO template image. The left dorsolateral prefrontal cortex (PFCdl), which showed mild but nonnegligible delay period activity, is also shown in the same format for comparison. (B) Time-course data aligned to the cue stimulus onset (time 0), sampled from the SMA that showed delay period activity (left panel). This area showed delay period activity that was building up toward the cue stimulus (gray shades), similar for the movement (black line) and imagery (gray line) events. Activity from PFCdl is shown for comparison (right panel). (C) The delay period activity just before the cue stimulus presentation was approximated by regression lines in both the SMA and PFCdl. The regression slope of the delay period activity was positive in the SMA (left panel), whereas it was negative in the PFCdl (right panel), which meant that the D1 activity was increasing toward the cue stimulus presentation in the SMA whereas it was decreasing toward it in the PFCdl.
Figure 5.
Figure 5.
Type I activity aligned to the IS onset. Activity related to the movement events (black line) and the imagery events (gray line) were aligned to the IS onset (time 0) and were averaged separately for the 1st delay period of 12, 15, and 18 s, corresponding to the 3 different gray and black lines. Gray shades indicate the period of time during which the number stimuli were presented. Type I areas showed marked movement-related activity. There was little imagery-related activity in the type Ia areas but were mild imagery-related as well as IS-related activities in the type Ib areas.
Figure 6.
Figure 6.
Type II activity aligned to the IS onset. Note remarkable activity following the IS presentation (gray shades) for the type II areas. Type II areas included brain areas where there was relative exaggeration of the IS-related activity compared with the cue stimulus–related activity (e.g., right inferior frontal gyrus and right superior parietal lobule). See legends for Figure 5 for the display conventions. PMd/pre-PMd, intersection of the PMd and pre-PMd.
Figure 7.
Figure 7.
Type III activity aligned to the IS onset. Type III areas showed marked IS-related activity as did the type II areas. See legends for Figure 5 for the display conventions. pre-SMA, rostral part of the supplementary motor areas; pre-PMd, rostral and dorsal sector of the lateral premotor cortex; FEF, presumable frontal eye fields.
Figure 8.
Figure 8.
Three-dimensional plots of IS-, movement-, and imagery- related activity. The mean amplitude of each event-related activity was expressed in percent signal changes (see Table 6) and plotted against each other for each brain area sampled for the time-course analysis. The IS-related activity was correlated positively with the imagery-related activity (r = 0.632, P = 0.001) and inversely with the movement-related activity (r = −0.540, P = 0.005).

References

    1. Abe M, Hanakawa T, Takayama Y, Kuroki C, Ogawa S, Fukuyama H. Functional coupling of human prefrontal and premotor areas during cognitive manipulation. J Neurosci. 2007;27:3429–3438. - PMC - PubMed
    1. Allen G, Buxton RB, Wong EC, Courchesne E. Attentional activation of the cerebellum independent of motor involvement. Science. 1997;275:1940–1943. - PubMed
    1. Amiez C, Kostopoulos P, Champod AS, Petrides M. Local morphology predicts functional organization of the dorsal premotor region in the human brain. J Neurosci. 2006;26:2724–2731. - PMC - PubMed
    1. Ashburner J, Friston KJ. Nonlinear spatial normalization using basis functions. Hum Brain Mapp. 1999;7:254–266. - PMC - PubMed
    1. Bode S, Koeneke S, Jancke L. Different strategies do not moderate primary motor cortex involvement in mental rotation: a TMS study. Behav Brain Funct. 2007;3:38. - PMC - PubMed

Publication types