. 2008 Jul;95(2):629-40.
doi: 10.1529/biophysj.107.120725. Epub 2008 Mar 21.

Part I: an x-ray scattering study of cholera toxin penetration and induced phase transformations in lipid membranes

Affiliations

Part I: an x-ray scattering study of cholera toxin penetration and induced phase transformations in lipid membranes

C E Miller et al. Biophys J. 2008 Jul.

Abstract

Cholera toxin is a highly efficient biotoxin, which is frequently used as a tool to investigate protein-membrane interactions and as a reporter for membrane rafts. Cholera toxin binds selectively to gangliosides with highest affinity to GM(1). However, the mechanism by which cholera toxin crosses the membrane remains unresolved. Using x-ray reflectivity and grazing incidence diffraction, we have been able to monitor the binding and penetration of cholera toxin into a model lipid monolayer containing the receptor GM(1) at the air-water interface. Very high toxin coverage was obtained allowing precise measurements of how toxin binding alters lipid packing. Grazing incidence x-ray diffraction revealed the coexistence of two monolayer phases after toxin binding. The first was identical to the monolayer before toxin binding. In regions where toxin was bound, a second membrane phase exhibited a decrease in order as evidenced by a larger area per molecule and tilt angle with concomitant thinning of the monolayer. These results demonstrate that cholera toxin binding induces the formation of structurally distinct, less ordered domains in gel phases. Furthermore, the largest decrease in lateral order to the monolayer occurred at low pH, supporting a low endosomal pH in the infection pathway. Surprisingly, at pH = 8 toxin penetration by the binding portion of the toxin, the B(5) pentamer, was also observed.


Figures

FIGURE 1
FIGURE 1
Scattering geometry for GIXD and XR. For XR, 2θxy = 0 and θ is changing. During GIXD, the angle of incidence, αi, of the x-ray beam is less than the angle of total external reflection from the air-water interface. The cartoon is a schematic representation of the lipid-protein system. The lipid monolayer is composed of an 80:20 mol % mixture of DPPE:GM1. CTB5 and CTAB5 bind to the monolayer in the approximate orientation shown.
FIGURE 2
FIGURE 2
A typical area expansion of a 80:20 mol % mixture of DPPE:GM1 monolayer at a constant pressure of 20 mN/m after injection of CTAB5 and CTB5 into the subphase at t = 0 s. The area expansion was similar for both toxins. After DTT was injected into the subphase and disulfide bond reduction was initiated, the rate of expansion was greatly increased for CTAB5. Cholera toxin and DTT were allowed to incubate for 1–3 h before x-ray scattering experiments. Percent area/molecule increase = [(area/molecule) − (initial area/molecule)] / (initial area/molecule) × 100%.
FIGURE 3
FIGURE 3
X-ray reflectivity results at pH = 8. For clarity, the experiment set is separated into two parts. (a and b) A DPPE:GM1 monolayer with bound CTB5 (before and after injection of DTT). (c and d) A DPPE:GM1 monolayer with bound CTAB5 (before and after injection of DTT). (a and c) The measured reflectivity plotted as R/RFresnel vs. qz. Error bars for the reflectivity data represent statistical errors in these measurements. Measured data are represented as symbols, and lines (solid and dashed) represent fits corresponding to the electron density profiles shown in b and d. The electron densities ρ(z) are normalized to the electron density of water, ρwater 0.334 e/Å−3. In the electron density profiles the binding of both CTB5 and CTAB5 can clearly be seen by a large electron density increase extending into the subphase from the GM1 headgroup region. Binding of toxin results in a decrease in electron density in the headgroup region and a small increase in density in the lipid tail region. After injection of DTT, there was a substantial density increase in the lipid tail region suggesting that both CTB5 and CTAB5 are entering the lipid region (Fig. 4). Surprisingly, CTB5 and CTAB5 had similar effects on the lipid monolayer at pH = 8. These results are distinctly different from results at pH = 5 (discussed later).
FIGURE 4
FIGURE 4
Close-up of the electron density profile of the lipid monolayer region from Fig. 3, b and d. All curves are referenced to the headgroup peak density (dotted vertical line). Before injection of DTT, the electron density profile of the tail region had the same characteristics as the monolayer before toxin was present. After injection of DTT, both CTB5 and CTAB5 caused a significant increase in density of the tail region suggesting that toxin entered the lipid region of the monolayer.
FIGURE 5
FIGURE 5
XR results at pH = 5. (a and b) A DPPE:GM1 monolayer with bound CTB5 (before and after injection of DTT). (c and d) A DPPE:GM1 monolayer with bound CTAB5 (before and after injection of DTT). (a and c) The measured reflectivity plotted as R/RFresnel vs. qz. Error bars for the reflectivity data represent statistical errors in these measurements. Measured data are represented as symbols, and lines (solid and dashed) represent fits corresponding to the electron density profiles shown in b and d. There is one major difference observed when compared to XR results at pH = 8. CTB5 + DTT did not significantly perturb the electron density of the lipid monolayer region. This similarity can be seen both in the measured reflectivity profiles (a) and the electron density profiles (b). As in the case of pH = 8, CTAB5 + DTT caused a large electron density increase in the lipid tail region.
FIGURE 6
FIGURE 6
The electron density profiles illustrate the variance in the amount of toxin coverage between samples. Shown are two data sets for CTB5 and two for CTAB5, all at pH = 5. Both CTAB5 profiles have been shifted up 0.3 for clarity. The calculated coverage ranged from 49% to 62%, consistent with the area expansion measured on the trough. There are small differences in the electron density of the monolayer region when different amounts of toxin are bound, but these are not sufficient to account for the variation in monolayer perturbation and toxin penetration at different pH (Fig. 4).
FIGURE 7
FIGURE 7
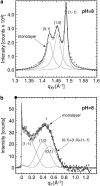
GIXD from the ordered alkyl tail regions at pH = 8 of a DPPE:GM1 monolayer. Bragg peaks are shown in a and the total Bragg rod (sum of the three individual Bragg rods) is shown in b. The individual Bragg rod reflections are shown in gray. The three GIXD Bragg peaks observed indicate packing of the lipid tails in an oblique 2D unit cell. The Miller indices {h, k} are indicated for each peak. Bragg peaks in a were obtained by integrating over the (−0.05 Å−1qz ≤ 0.9 Å−1) region and each peak was fitted using a Voight function (gray solid lines). By integrating over the (1.38 Å−1qxy ≤ 1.55 Å−1) region, the Bragg rod (b) was fitted (solid line) by approximating the coherently scattering part of the alkyl tail by a cylinder of constant electron density. The sharp peak at qz = 0.01Å−1 is the so-called Yoneda–Vineyard peak (38), which arises from the interference between x-rays diffracted up into the monolayer and x-rays diffracted down and then reflected up by the interface. The molecular packing parameters used in the fitting are listed in Table 1.
FIGURE 8
FIGURE 8
(a) Reciprocal space contour plot, I(qxy, qz), of a pure monolayer at pH = 8 (phase 1). The integrated Bragg peaks and Bragg rods for the pure monolayer phase are shown in Fig. 7. (b) Reciprocal space contour plot, I(qxy, qz), after injection of CTAB5 at pH = 8. The dramatic change in intensity distribution between a and b signifies a different packing distribution of the lipid tails into a new monolayer phase (phase 2). This is an extreme case of cholera toxin's perturbation to the lipid monolayer and the lack of phase 1 enabled the unit cell for phase 2 to be extracted. (c) Bragg peaks corresponding to b. Bragg peaks in c were obtained by integrating over the (−0.05 Å−1qz ≤ 0.8 Å−1) region, and the peak was fitted using a Voight function (solid line). (d) Bragg rods corresponding to b. By integrating over the (1.3 Å−1qxy ≤ 1.6 Å−1) region, the Bragg rod (d) was fitted (solid line) by approximating the coherently scattering part of the alkyl tail by a cylinder of constant electron density. In most cases, the resulting diffraction pattern after injection of cholera toxin was the combination of phase 1 (a) and phase 2 (b). The shoulder on the high qxy side of the Bragg peak (indicated by arrow) in c is from the remaining monolayer phase where toxin did not bind.
FIGURE 9
FIGURE 9
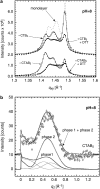
Bragg peaks and rods from GIXD measurements at pH = 8. (a) Bragg peaks for a DPPE:GM1 monolayer with bound CTB5, CTB5 + DTT, CTAB5, and CTAB5 + DTT. Symbols represent measured data and lines represent the total (sum of three Bragg peaks) peak fit. Diffraction from the bare monolayer with no toxin present is shown as a dashed line for comparison. (b) The Bragg rod for a DPPE:GM1 monolayer with bound CTAB5 plotted with total fit (phase 1 + phase 2). Below, the contribution from phase 1 and phase 2 is shown. The lines under the phase 1 line are the individual {0,1}, {1,0} and {1,−1} Bragg rods for phase 1 similar to Fig. 7 b. For clarity, the CTB5 and CTB5 + DTT Bragg peaks in a have been offset vertically by 2 × 10⁴ counts and the CTAB5 Bragg rod in b by 10 counts. Molecular packing parameters used in the fits are listed in Table 1. Bragg rods, integrated over the (qxy, qz) = (1.38−1.55 Å−1, −0.05−0.9 Å−1) region, were fitted (solid lines) by using the sum of two phases. Phase 1 represented the structure of the bare monolayer (Fig. 8 a) or where no toxin was bound. Phase 2 represented the highly tilted toxin-affected phase (Fig. 8 b).

References

    1. Middlebrook, J. L., and R. B. Dorland. 1984. Bacterial toxins—cellular mechanisms of action. Microbiol. Rev. 48:199–221. - PMC - PubMed
    1. Zhang, R. G., D. L. Scott, M. L. Westbrook, S. Nance, B. D. Spangler, G. G. Shipley, and E. M. Westbrook. 1995. The three-dimensional crystal structure of cholera toxin. J. Mol. Biol. 251:563–573. - PubMed
    1. Zhang, R. G., M. L. Westbrook, E. M. Westbrook, D. L. Scott, Z. Otwinowski, P. R. Maulik, R. A. Reed, and G. G. Shipley. 1995. The 2.4 angstrom crystal structure of cholera toxin B subunit pentamer—choleragenoid. J. Mol. Biol. 251:550–562. - PubMed
    1. Feng, Y., A. P. Jadhav, C. Rodighiero, Y. Fujinaga, T. Kirchhausen, and W. I. Lencer. 2004. Retrograde transport of cholera toxin from the plasma membrane to the endoplasmic reticulum requires the trans-Golgi network but not the Golgi apparatus in Exo2-treated cells. EMBO Rep. 5:596–601. - PMC - PubMed
    1. Mekalanos, J. J., R. J. Collier, and W. R. Romig. 1979. Enzymic activity of cholera toxin. 2. Relationships to proteolytic processing, disulfide bond reduction, and subunit composition. J. Biol. Chem. 254:5855–5861. - PubMed

Publication types

LinkOut - more resources