. 2008 Mar 25;105(12):4838-43.
doi: 10.1073/pnas.0712216105. Epub 2008 Mar 21.

Hedgehog signaling overrides p53-mediated tumor suppression by activating Mdm2

Affiliations

Hedgehog signaling overrides p53-mediated tumor suppression by activating Mdm2

Yoshinori Abe et al. Proc Natl Acad Sci U S A. .

Abstract

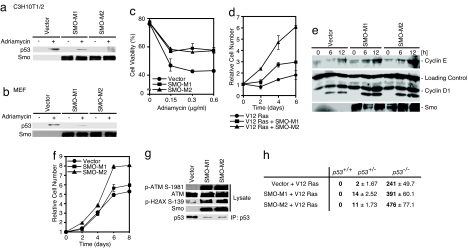
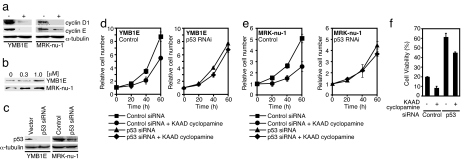
The hedgehog (Hh) signaling pathway regulates the development of many organs in mammals, and activation of this pathway is widely observed in human cancers. Although it is known that Hh signaling activates the expression of genes involved in cell growth, the precise role of the Hh pathway in cancer development is still unclear. Here, we show that constitutively activated mutants of Smoothened (Smo), a transducer of the Hh signaling pathway, inhibit the accumulation of the tumor suppressor protein p53. This inhibition was also observed in the presence of Hh ligand or with the overexpression of the transcription factors Gli1 and Gli2, downstream effectors of Smo, indicating that this inhibition is specific for the Hh pathway. We also report that Smo mutants augment p53 binding to the E3 ubiquitin-protein ligase Mdm2 and promote p53 ubiquitination. Furthermore, Hh signaling induced the phosphorylation of human Mdm2 protein on serines 166 and 186, which are activating phosphorylation sites of Mdm2. Smo mutants enhanced the proliferation of mouse embryonic fibroblasts (MEFs) while inducing a DNA-damage response. Moreover, Smo partially inhibited p53-dependent apoptosis and cell growth inhibition in oncogene-expressing MEFs. We also found that accumulation of p53 is inhibited by Hh signaling in several human cancer cell lines. Therefore, the Hh pathway may be a powerful accelerator of oncogenesis by activating cell proliferation and inhibiting the p53-mediated anti-cancer barrier induced by oncogenic stress.


Conflict of interest statement

The authors declare no conflict of interest.

Figures

Fig. 1.
Fig. 1.
Hh signaling inhibits p53 activity and down-regulates p53. (a and b) A WT (SMO-WT) or mutant (SMO-M1 or SMO-M2) Smo expression plasmid was transfected into Saos-2 cells (a) or C3H10T1/2 cells (b), with (+p53) or without the p53 expression plasmid and with the RGC-luc reporter plasmid containing synthetic p53-binding sequences (39). Luciferase activity was measured 48 h after transfection. The histogram shows the means of three independent experiments, and error bars show standard deviations (SDs). (c) p53 (+p53) and gD-tagged Smo expression plasmids (SMO-WT, SMO-M1, and SMO-M2) were transfected into C3H10T1/2 cells, and the amount of p53 was determined by immunoblotting. The Smo protein level was determined by using an anti-gD antibody. (d) The Smo expression plasmid was transfected into C3H10T1/2 cells. Forty-eight hours after transfection, p53 was detected by immunoprecipitation (IP), using anti-p53 (FL-393) antibody, followed by immunoblotting with a different anti-p53 (Pab246) antibody. (e) C3H10T1/2 cells were treated with the indicated amounts of mouse sonic hedgehog N-terminal peptide (Shh-N; R&D Systems) for 48 h. The amount of p53 was determined as described in d.
Fig. 2.
Fig. 2.
Hh signaling promotes p53 ubiquitination and activates Mdm2. (a) RNA blotting, using total RNA from MEFs carrying the control vector and expressing Smo mutants, was carried out by using p53, Mdm2, Pirh2, and COP1 cDNA probes. 28s rRNA was examined as a loading control. (b) p53 and Smo expression plasmids were transfected into C3H10T1/2 cells, which were treated with 50 μM MG132 for 4 h before collection. Forty-eight hours after transfection, the amount of p53 was determined by immunoblotting. (c) C3H10T1/2 cells were transfected with expression plasmds for Flag-tagged ubiquitin, HA-p53, and the Smo mutant and treated with 50 μM MG132 for 4 h before harvesting. Twenty-four hours after transfection, ubiquitinated p53 was detected by immunoprecipitation with anti-HA antibody and immunoblotting with anti-Flag or anti-p53 antibody. Mono-ubiquitinated (Ub) and polyubiqutinated (Ub) p53 are indicated. (d) HA-tagged p53 expression plasmid was transfected into C3H10T1/2 cells, and the cells were incubated with 5 μg/ml Shh-N for 24 h. Ubiquitinated p53 was detected by immunoprecipitation with anti-HA antibody and immunobloting with anti-p53 (FL-393) antibody. (e) C3H10T1/2 cells were incubated with indicated amount of Shh-N for 48h. Ubiquitinated p53 was detected by immunoprecipitation with anti-p53 polyclonal antibody and immunobloting with anti-p53 monoclonal antibody. (f) The p53 expression vector was transfected into C3H10T1/2 cells with or without Smo mutants. p53 (red) was detected by using anti-p53 (FL-393) antibody; Smo (green) was visualized by using anti-gD antibody. The nucleus (blue) was stained with DAPI. (g) Quantification of p53 staining was performed as described in f. The staining pattern for p53 in cells expressing p53 and Smo mutants was scored for 100 cells in three separate experiments. The graph indicates the percentages of cells with the indicated p53 localization patterns. Bars indicate the SD of three independent experiments. (h) SMO-M1 or -M2 expression plasmid was transfected into C3H10T1/2 cells, and the cells were then treated with 50 μM MG132 for 4 h before harvest. Forty-eight hours after transfection, cell lysates were subjected to immunoprecipitation with anti-p53 antibody (FL-393) and immunoblotting with anti-p53 (Pab246) or anti-Mdm2 (2A10) antibody. (i) HA-tagged p53, mutant Smo, and Flag-tagged ubiquitin expression plasmids were transfected into GFP siRNA (Control)- and Mdm2 siRNA-expressing C3H10T1/2 cells. Twenty-four hours after transfection, detection of ubiquitination of p53 was performed as described in c. (j) Mutant Smo expression vectors were transfected into C3H10T1/2 cells. Cells were incubated with 15 μM Nutlin-3 (Calbiochem) for 16 h. p53 was detected by immunoprecipitation (IP), using anti-p53 (FL-393) antibody, followed by immunoblotting (IB) with a different anti-p53 (Pab246) antibody.
Fig. 3.
Fig. 3.
Hh signaling induces Hdm2 activation and p53 destabilization. (a) Flag-tagged Hdm2 and Smo expression plasmids were transfected into C3H10T1/2 cells. The cells were subjected to serum starvation for 6 h before collection, and Hdm2 phosphorylation was detected by immunoprecipitation with anti-Flag antibody and immunoblotting with anti-phospho-Hdm2 (Ser-166 or Ser-186) antibody. (b) C3H10T1/2 cells were treated with 3 μg/ml Shh-N for 48 h. The amount of p53 was determined as described above. Endogenous Akt phosphorylation was detected by immunoblotting, using anti-phospho-Akt (Ser-473) antibody. (c–e) HA-tagged Gli1 (c), Myc-tagged Gli2 (d), or HA-tagged Gli3 (e) expression plasmid was transfected into C3H10T1/2 cells. MG132 (50 μM) was treated for 4 h before harvest (a and d). The amount of p53 protein was determined as described in Fig. 1d. Gli1 and Gli2 expression was determined by immunoblotting, using antibodies against each tag. (f) p53 and SMO-M2 expression plasmids were transfected into C3H10T1/2 cells with or without the Myc-tagged SuFu expression plasmid (40). Forty-eight hours after transfection, the amount of p53 protein was determined by immunoblotting. The expression of SuFu was also determined by using anti-Myc-tag antibody. (g) The Flag-tagged Hdm2 expression vector was transfected into C3H10T1/2 cells, and the cells were incubated with 1 μg/ml Shh-N for 48 h. To inhibit protein synthesis, 80 μg/ml cycloheximide (CHX) was added to the culture, which was then incubated for 2 h before harvest. Detection of phosphorylated Hdm2 was performed as described in a.
Fig. 4.
Fig. 4.
Smo mutants activate cell growth, evoke DNA-damage-induced responses, and suppress p53 expression. (a and b) Mutant Smo expression plasmid or control plasmid (Vector) was transfected into C3H10T1/2 cells (a). Forty eight hours after transfection, the cells were incubated with 0.6 μg/ml adriamycin for 4 h. MEFs expressing SMO-M1 or SMO-M2 via recombinant retrovirus were also treated with adriamycin b. The amount of p53 was determined as described in Fig. 1c. (c) MEFs expressing E1A via retrovirus were also infected with control retrovirus (Vector) or Smo mutant (SMO-M1 or SMO-M2)-expressing retrovirus. Cells were incubated with adriamycin for 24 h and then subjected to a cell viability assay. Results are shown as means ± SD of triplicate experiments. (d) Growth curves for V12 Ras- and mutant Smo-expressing MEFs via retrovirus are shown. Bars indicate the SD from triplicate experiments. (e) The cell cycle of SMO-M1- or SMO-M2-expressing MEFs via retrovirus was arrested at the G1-phase by serum starvation, then the cells were cultured with 10% FBS to continue the cell cycle. At the indicated time points, the cells were harvested, and cyclins D1 and E were detected by immunoblotting. (f) The growth curves for control retrovirus-carrying (Vector), and SMO-M1- or SMO-M2-expressing retrovirus-carrying MEFs are shown. Bars indicate the SD from triplicate experiments. (g) Mutant Smo was stably expressed via transfection of recombinant retrovirus into MEFs. DNA-damage responses were determined by immunoblotting with anti-phospho-ATM (Ser-1981) and anti-phospho-histone H2AX (Ser-139) antibodies. The expression levels of ATM and Smo mutants were also determined by immunoblotting. The amount of p53 was determined as described in Fig. 1d. (h) Mutant Smo and V12 Ras were expressed via recombinant retrovirus in MEFs. A quantitative colony formation assay was performed by plating mutant Smo- and V12Ras-expressing cells at a density of 1 × 10⁴ cells per 35-mm dish and incubating them for 14 days. Surviving colonies were counted and represented as the means ± SD of three independent dishes.
Fig. 5.
Fig. 5.
KAAD cyclopamine treatment restores p53 expression in breast cancer cell lines. (a) Cells were treated with 1 μM KAAD cyclopamine (Calbiochem) for 72 h and collected, and the levels of cyclins D1 and E were determined by immunoblotting. (b) The cells were treated with KAAD cyclopamine at the indicated doses for 48 h and collected, and the p53 level was determined by immunoblotting. (c) p53 siRNA was expressed (41) by recombinant retrovirus. p53 level was determined by immunoblotting. (d and e) YMB1E (2 × 10⁵) (d) and MRK-nu-1 (e) cells were incubated with 1 μM KAAD cyclopamine for the indicated lengths of time, and viable cells were counted. Results are shown as means ± SD from triplicate experiments. (f) YMB1E cells were incubated with 1 μM KAAD cyclopamine and 0.6 μg/ml adriamycin for 48 h and subjected to a cell viability assay. Results are shown as means ± SD from triplicate experiments.

References

    1. Beachy PA, Karhadkar SS, Berman DM. Tissue repair and stem cell renewal in carcinogenesis. Nature. 2004;432:324–331. - PubMed
    1. Ingham PW, McMahon AP. Hedgehog signaling in animal development: Paradigms and principles. Genes Dev. 2001;15:3059–3087. - PubMed
    1. Ingham PW, Placzek M. Orchestrating ontogenesis: Variations on a theme by sonic hedgehog. Nat Rev Genet. 2006;7:841–850. - PubMed
    1. Pasca di Magliano M, Hebrok M. Hedgehog signalling in cancer formation and maintenance. Nat Rev Cancer. 2003;3:903–911. - PubMed
    1. Berman DM, et al. Widespread requirement for Hedgehog ligand stimulation in growth of digestive tract tumours. Nature. 2003;425:846–851. - PubMed

Publication types

MeSH terms