The risk of exposure to diagnostic ultrasound in postnatal subjects: thermal effects
- PMID: 18359907
- PMCID: PMC2724319
- DOI: 10.7863/jum.2008.27.4.517
The risk of exposure to diagnostic ultrasound in postnatal subjects: thermal effects
Abstract
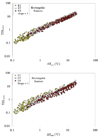
This review evaluates the thermal mechanism for ultrasound-induced biological effects in postnatal subjects. The focus is the evaluation of damage versus temperature increase. A view of ultrasound-induced temperature increase is presented, based on thermodynamic Arrhenius analyses. The hyperthermia and other literature revealed data that allowed for an estimate of a temperature increase threshold of tissue damage for very short exposure times. This evaluation yielded an exposure time extension of the 1997 American Institute of Ultrasound in Medicine Conclusions Regarding Heat statement (American Institute of Ultrasound in Medicine, Laurel, MD) to 0.1 second for nonfetal tissue, where, at this exposure time, the temperature increase threshold of tissue damage was estimated to be about 18 degrees C. The output display standard was also evaluated for soft tissue and bone cases, and it was concluded that the current thermal indices could be improved to reduce the deviations and scatter of computed maximum temperature rises.
Figures


Similar articles
-
Is diagnostic ultrasound safe? Current international consensus on the thermal mechanism.Med J Aust. 1994 Jan 3;160(1):33-7. Med J Aust. 1994. PMID: 8271983
-
Intracranial temperature elevation from diagnostic ultrasound.Ultrasound Med Biol. 2001 Jul;27(7):883-8. doi: 10.1016/s0301-5629(01)00367-2. Ultrasound Med Biol. 2001. PMID: 11476919 Review.
-
[Obstetrical ultrasound: can the fetus hear the wave and feel the heat?].Ultraschall Med. 2012 Jun;33(3):215-7. doi: 10.1055/s-0032-1312759. Epub 2012 Jun 14. Ultraschall Med. 2012. PMID: 22700164 German.
-
Models and regulatory considerations for transient temperature rise during diagnostic ultrasound pulses.Ultrasound Med Biol. 2002 Sep;28(9):1217-24. doi: 10.1016/s0301-5629(02)00558-6. Ultrasound Med Biol. 2002. PMID: 12401393
-
Comparison of Thermal Safety Practice Guidelines for Diagnostic Ultrasound Exposures.Ultrasound Med Biol. 2016 Feb;42(2):345-57. doi: 10.1016/j.ultrasmedbio.2015.09.016. Epub 2015 Nov 28. Ultrasound Med Biol. 2016. PMID: 26626492 Review.
Cited by
-
The use of transvaginal ultrasound alters physiologic uterine peristalsis in gynecologic participants.F S Rep. 2024 Jun 25;5(3):296-303. doi: 10.1016/j.xfre.2024.06.004. eCollection 2024 Sep. F S Rep. 2024. PMID: 39381650 Free PMC article.
-
Modeling the thermo-acoustic effects of thermal-dependent speed of sound and acoustic absorption of biological tissues during focused ultrasound hyperthermia.J Med Ultrason (2001). 2015 Oct;42(4):489-98. doi: 10.1007/s10396-015-0643-3. Epub 2015 Jun 13. J Med Ultrason (2001). 2015. PMID: 26576973
-
Flexible integration of high-imaging-resolution and high-power arrays for ultrasound-induced thermal strain imaging (US-TSI).IEEE Trans Ultrason Ferroelectr Freq Control. 2013 Dec;60(12):2645-56. doi: 10.1109/TUFFC.2013.2863. IEEE Trans Ultrason Ferroelectr Freq Control. 2013. PMID: 24297029 Free PMC article.
-
What challenges must be overcome before ultrasound elasticity imaging is ready for the clinic?Imaging Med. 2011 Aug;3(4):433-444. doi: 10.2217/iim.11.41. Imaging Med. 2011. PMID: 22171226 Free PMC article.
-
CEM43°C thermal dose thresholds: a potential guide for magnetic resonance radiofrequency exposure levels?Eur Radiol. 2013 Aug;23(8):2215-27. doi: 10.1007/s00330-013-2825-y. Epub 2013 Apr 4. Eur Radiol. 2013. PMID: 23553588 Free PMC article.
References
-
- O’Brien WD., Jr . Ultrasonic dosimetry. In: Fry FJ, editor. Ultrasound: Its Applications in Medicine and Biology. New York, NY: Elsevier; 1978. pp. 343–391.
-
- National Council on Radiation Protection and Measurements. Exposure Criteria for Diagnostic Medical Ultrasound, Part 1: Criteria Based on Thermal Mechanisms. Bethesda, MD: National Council on Radiation Protection and Measurements; 1992. Report 113.
-
- Ellis DS, O’Brien WD., Jr The monopole-source solution for estimating tissue temperature increases for focused diagnostic ultrasound. IEEE Trans Ultrason Ferroelectr Freq Control. 1996;43:88–97.
-
- O’Brien WD, Jr, Ellis DS. Evaluation of the soft-tissue thermal index. IEEE Trans Ultrason Ferroelectr Freq Control. 1999;46:1459–1476. - PubMed
-
- O’Brien WD, Jr, Yang Y, Simpson DG. Evaluation of unscanned-mode soft-tissue thermal index for rectangular sources and proposed new indices. Ultrasound Med Biol. 2004;30:965–972. - PubMed
Publication types
MeSH terms
Grants and funding
LinkOut - more resources
Full Text Sources
Other Literature Sources

