

Differential associations between actual and expected GP practice prescribing rates for statins, ACE inhibitors, and beta-blockers: a cross-sectional study in England
- PMID: 18360545
- PMCID: PMC1661602
- DOI: 10.2147/tcrm.1.1.61.53599
Differential associations between actual and expected GP practice prescribing rates for statins, ACE inhibitors, and beta-blockers: a cross-sectional study in England
Abstract
Aim: To explore the relationship between actual and expected general medical practitioner (GP) practice prescribing rates for statins, angiotensin converting enzyme (ACE) inhibitors, and beta-blockers.
Background: There is a growing body of literature highlighting inequities in GP practice prescribing rates for many drug therapies. The equity of prescribing is of central importance in the area of therapeutics since it explores the interface between those patients who should and those who actually do receive a drug therapy.
Setting: Four primary care trusts (PCTs 1-4) in the North West of England, including 132 GP practices.
Methods: Actual and expected prescribing rates for statins, beta-blockers, and ACE inhibitors were specifically developed for each GP practice.
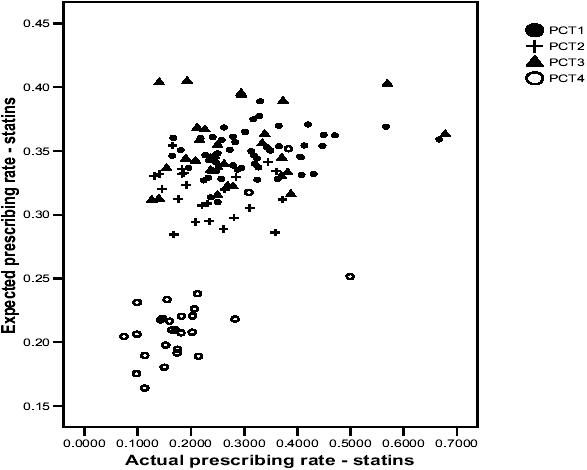
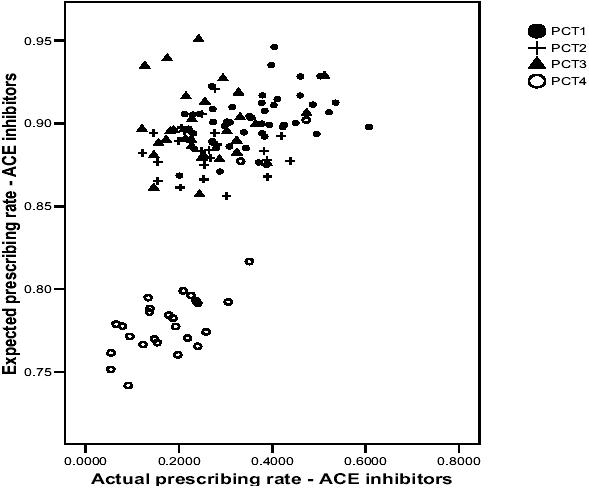
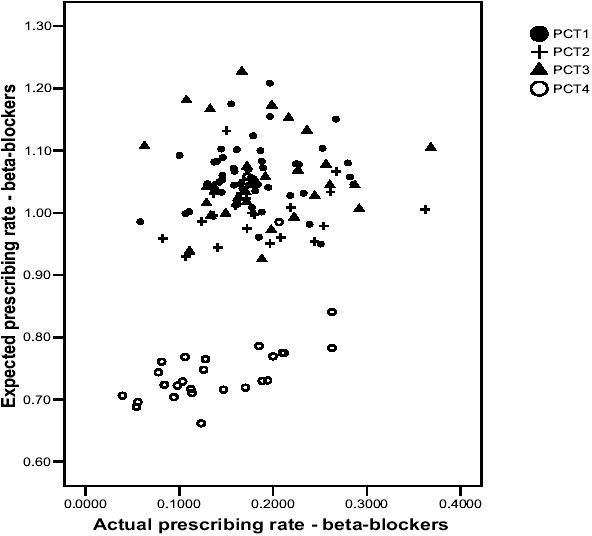
Results: There were no statistically significant correlations between actual and expected prescribing rates in PCT2 and PCT3, although in PCT1 there were statistically significant correlations for statins (0.286, p < 0.05) and ACE inhibitors (0.381, p < 0.01). In PCT4, correlations were moderate to high for beta-blockers (0.693, p < 0.01), and moderate for statins (0.541, p < 0.05) and ACE inhibitors (0.585, p < 0.01). Scatterplots highlighted large variations between individual GP practices (both within and between PCTs) in terms of the relationship between actual and expected prescribing rates.
Conclusion: This paper highlights variability between PCTs and GP practices in terms of the relationship between actual and expected prescribing rates. The findings from this paper may further advance the suggestion of inequities in prescribing rates for coronary heart disease (CHD) drugs, and studies such as this may be repeated in different therapeutic areas, healthcare settings, and countries.
Figures
References
-
- Blood Pressure Lowering Treatment Trialists' Collaboration. Effects of ACE inhibitors, calcium antagonists, and other blood-pressure-lowering drugs: results of prospectively designed overviews of randomised trials. Lancet. 2000;356:1955–64. - PubMed
-
- Bradshaw J. A taxonomy of social need. In: McLachlan G, editor. Problems and progress in medical care. Oxford: Nuffield Provincial Hospital Trust; 1972.
-
- Bradshaw J. The conceptualisation and measurement of need. In: Popay J, Williams G, editors. Researching the people's health. London: Routledge; 1994.
LinkOut - more resources
Full Text Sources
Miscellaneous
