. 2008 Jul;49(7):3178-84.
doi: 10.1167/iovs.08-1720. Epub 2008 Mar 24.

Ionic dysregulatory phenotyping of pathologic retinal thinning with manganese-enhanced MRI

Affiliations

Ionic dysregulatory phenotyping of pathologic retinal thinning with manganese-enhanced MRI

Bruce A Berkowitz et al. Invest Ophthalmol Vis Sci. 2008 Jul.

Abstract

Purpose: To test the hypothesis that manganese-enhanced MRI (MEMRI) provides a sensitive and robust measure of an important retinal ionic dysregulatory phenotype in pathologic retinal thinning.

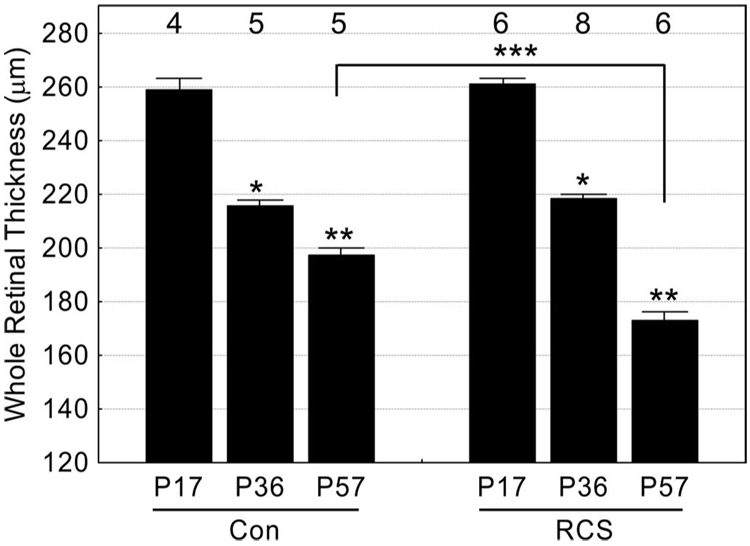
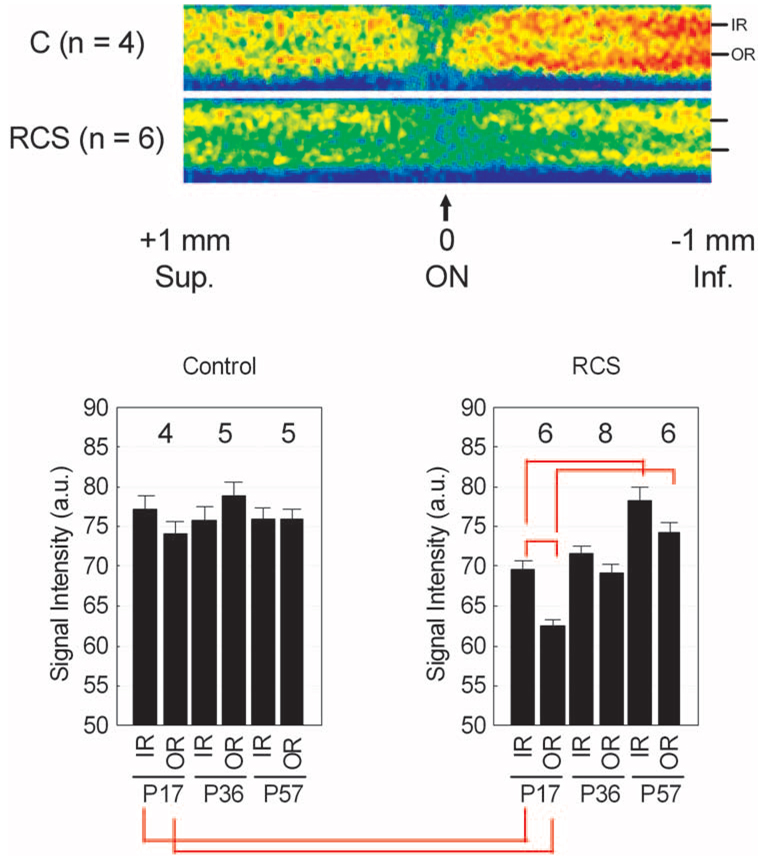
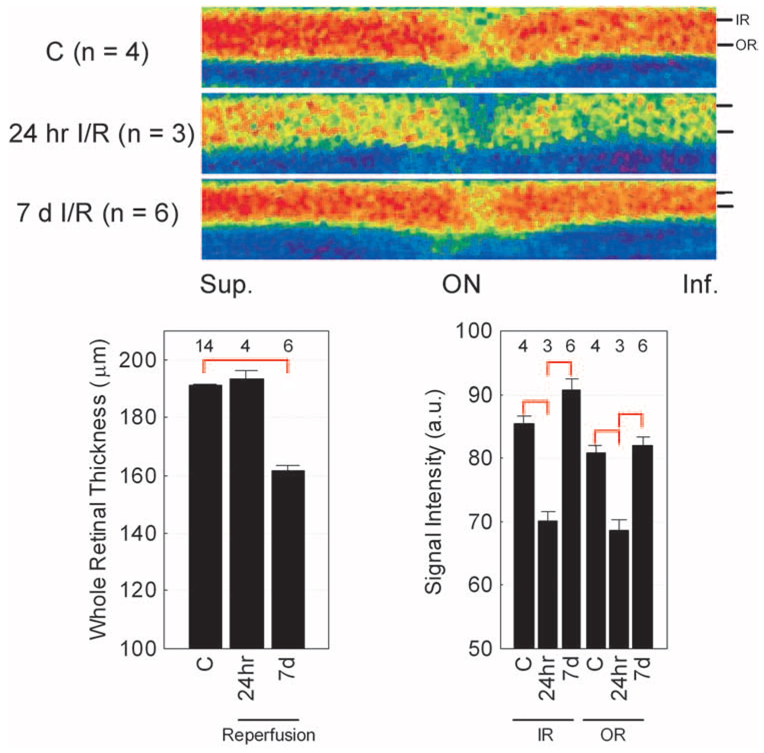
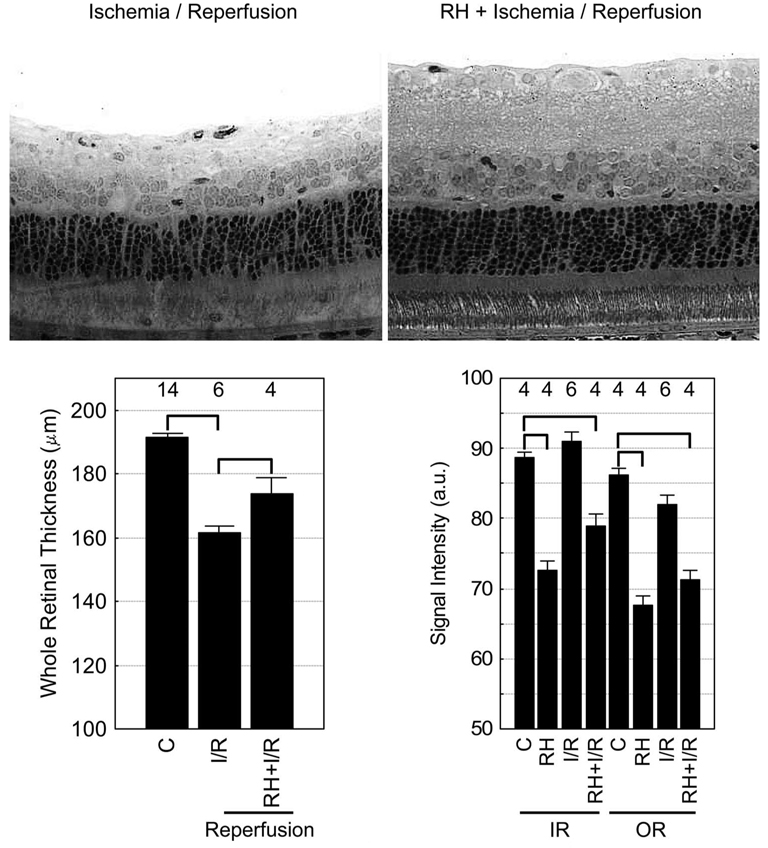
Methods: Four hours after intraperitoneal MnCl(2) injection, high-resolution MEMRI data were collected from overnight dark-adapted male control Sprague-Dawley and albino Royal College of Surgeons rats before (at development stage postnatal day [P] 17) and during photoreceptor degeneration (P36 and P57). In separate experiments, control rats, with and without repetitive hypoxic preconditioning, were subjected to high IOP (100 mm Hg) for 60 minutes followed by 24 hours or 7 days of reperfusion (e.g., ischemia/reperfusion). Central retinal thickness and intraretinal ion activity were measured from the MEMRI data. Histology examination was also performed to confirm retinal damage.

Results: In two different neurodegenerative models, MEMRI revealed first-time evidence for changes (P < 0.05) in intraretinal ion regulation before and during pathologic, but not (P > 0.05) developmental, retinal thinning. This phenotype was significantly altered by a neuroprotective repetitive hypoxic preconditioning protocol.

Conclusions: MEMRI and a nontoxic systemic dose of MnCl(2) provided an objective, noninvasive measure of an ionic deregulatory phenotype that appears useful for improved early diagnosis and treatment prognosis in a range of neurodegenerative diseases and their treatment.


Figures

FIGURE 1
FIGURE 1
Total retinal thickness measurements for male RCS rats at three time points: before (at developmental stage P17) and during (P36 and P57) photoreceptor degeneration. Age-matched control (con) rats were also studied. Numbers of animals used to generate these data are listed above bars. Error bars represent SEM. Brackets represent between-group comparisons with P < 0.05. *Significant differences from P17 data. **Significant differences from P17 and P36 data. ***Significant differences between P57 groups.
FIGURE 2
FIGURE 2
Summary of changes in MEMRI intraretinal signal intensity during development and degeneration. Top: pseudocolor linearized images of average retinal signal intensity in central retina of P17 dark-adapted control male Sprague–Dawley rats (top, C; n = 4) and RCS (bottom; n = 6). The same pseudocolor scale was used for both linearized images, where blue to green to yellow to red represent lowest to highest signal intensity. The intraretinal location used to extract inner retinal (IR) and outer retinal (OR) data used in this study are indicated on the right of each linearized image. The scale on the bottom indicates the location of the optic nerve (ON) and the superior and inferior directions. Bottom: summary of inner and outer retinal signal intensities over time for control (left) and RCS (right) rats. Red brackets: between-group comparisons with P < 0.05. Error bars are SEM, and numbers above bars are numbers of animals studied.
FIGURE 3
FIGURE 3
Summary of changes in MEMRI intraretinal signal intensity in I/R. Top: pseudocolor linearized images of average retinal signal intensity in central retina of dark-adapted control female Sprague–Dawley rats (top, C; n = 4) after 24 hours of reperfusion (middle, 24-hour I/R; n = 3) and 7 days of reperfusion (bottom, 7 d I/R; n = 6). The same pseudocolor scale was used for both linearized images, where blue to green to yellow to red represent lowest to highest signal intensity. The intraretinal location used to extract inner (IR) and outer (OR) retinal data used in this study is indicated on the right of each linearized image. The scale on the bottom indicates the location of the optic nerve (ON) and superior and inferior directions. Bottom: summary of temporal evolution of whole retinal thickness (left) and inner (IR) and outer (OR) retinal signal intensities. Red brackets: between-group comparisons, with P < 0.05. Error bars represent SEM, and numbers over bars are numbers of animals studied.
FIGURE 4
FIGURE 4
Summary of the effect of repetitive hypoxic preconditioning on MEMRI signal intensity in I/R. Top: representative retinal histology after I/R (left) and RH+I/R (right) in female Sprague–Dawley rats collected under the same magnification. One week after ischemia, samples were collected immediately after MEMRI examination. To optimize the visual display of these data, both images were digitally sharpened by the same extent and contrast enhanced automatically based on the signal histogram. These procedures ensured that subjective bias was not introduced. Bottom: whole retinal thickness (left) measured from MEMRI data from control (C) rats, rats that had undergone ischemia and 7 days of reperfusion (I/R), or rats that had first been preconditioned (RH) and then subjected to ischemia and reperfusion (RH+I/R). Inner retinal (IR) and outer retinal (OR) signal intensities (right) from each group. Brackets: between-group comparisons with P < 0.05. Error bars represent SEM, and numbers over bars are numbers of animals studied. Note the untreated 7-day I/R data are reproduced from Figure 3 to aid comparison.

Similar articles

Cited by

References

    1. Osborne NN, Casson RJ, Wood JP, Chidlow G, Graham M, Melena J. Retinal ischemia: mechanisms of damage and potential therapeutic strategies. Prog Retin Eye Res. 2004;23:91–147. - PubMed
    1. Ohguro H, Ohguro I, Mamiya K, Maeda T, Nakazawa M. Prolonged survival of the phosphorylated form of rhodopsin during dark adaptation of Royal College Surgeons rat. FEBS Lett. 2003;551:128–132. - PubMed
    1. Perlman I. Dark-adaptation in abnormal (RCS) rats studied electroretinographically. J Physiol. 1978;278:161–175. - PMC - PubMed
    1. Kalloniatis M, Tomisich G, Wellard JW, Foster LE. Mapping photoreceptor and postreceptoral labelling patterns using a channel permeable probe (agmatine) during development in the normal and RCS rat retina. Vis Neurosci. 2002;19:61–70. - PubMed
    1. Fox DA, Poblenz AT, He L, Harris JB, Medrano CJ. Pharmacological strategies to block rod photoreceptor apoptosis caused by calcium overload: a mechanistic target-site approach to neuroprotection. Eur J Ophthalmol. 2003;13 suppl 3:S44–S56. - PubMed

Publication types

MeSH terms