. 2008 Apr 14;205(4):883-95.
doi: 10.1084/jem.20072565. Epub 2008 Mar 24.

Distinct cell-specific control of autoimmunity and infection by FcgammaRIIb

Affiliations

Distinct cell-specific control of autoimmunity and infection by FcgammaRIIb

Rebecca J Brownlie et al. J Exp Med. .

Abstract

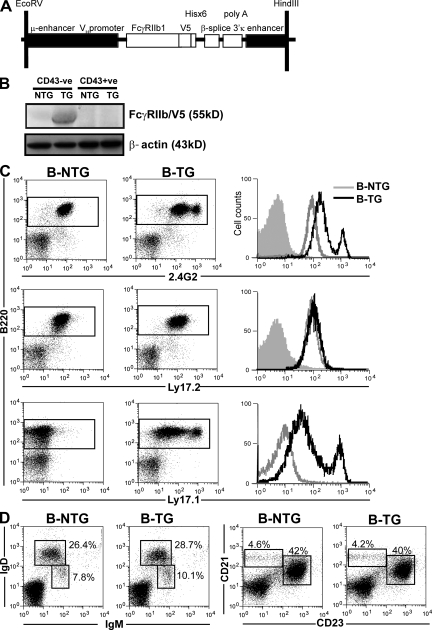
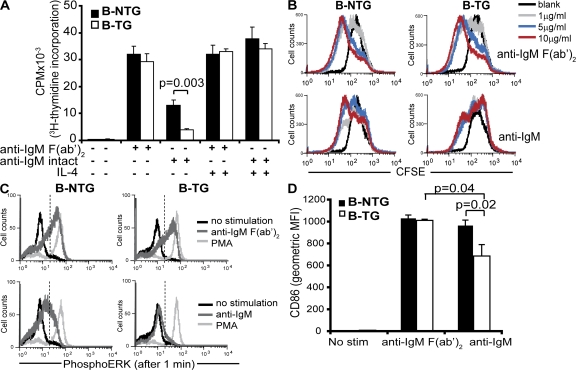
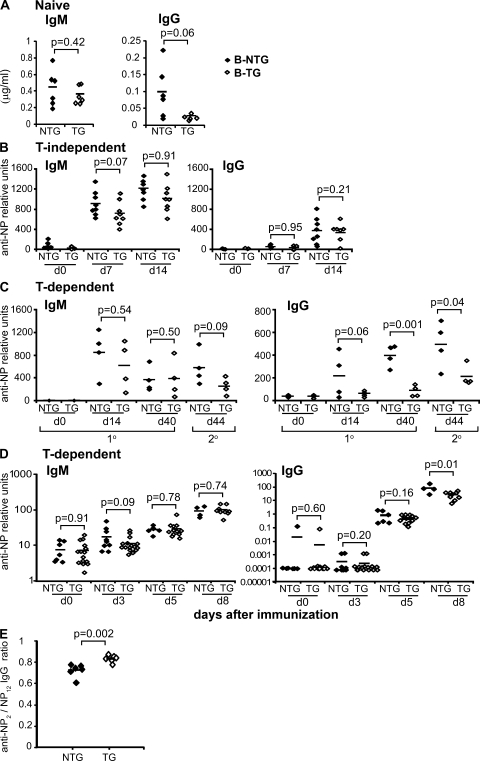
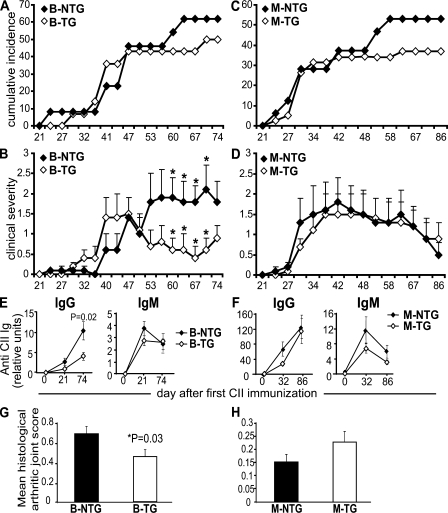
FcgammaRIIb is an inhibitory Fc receptor expressed on B cells and myeloid cells. It is important in controlling responses to infection, and reduced expression or function predisposes to autoimmunity. To determine if increased expression of FcgammaRIIb can modulate these processes, we created transgenic mice overexpressing FcgammaRIIb on B cells or macrophages. Overexpression of FcgammaRIIb on B cells reduced the immunoglobulin G component of T-dependent immune responses, led to early resolution of collagen-induced arthritis (CIA), and reduced spontaneous systemic lupus erythematosus (SLE). In contrast, overexpression on macrophages had no effect on immune responses, CIA, or SLE but increased mortality after Streptococcus pneumoniae infection. These results help define the role of FcgammaRIIb in immune responses, demonstrate the contrasting roles played by FcgammaRIIb on B cells and macrophages in the control of infection and autoimmunity, and emphasize the therapeutic potential for modulation of FcgammaRIIb expression on B cells in inflammatory and autoimmune disease.


Figures

Figure 1.
Figure 1.
Generation of B-TG mice overexpressing FcγRIIb. (A) The construct used to direct B cell–specific expression of transgenic FcγRIIb. (B) Western blot, using a V5-specific antibody, of splenic B cell (CD43−ve) and non–B cell (CD43+ve) populations from B-TG and B-NTG mice. (C) Flow cytometric analysis of transgene expression on B220+ splenic cells (as shown in the gated populations on the dot plots) from B-NTG and B-TG mice. Histograms represent either 2.4G2 (which recognizes all FcγRIIb on B cells), Ly17.2 (endogenous FcγRIIb-specific), or Ly17.1 (transgenic FcγRIIb-specific) expression (shaded histogram = isotype control). No detectable transgene expression was demonstrated on non–B cells (Fig. S2). (D) The proportions of B cell subsets analyzed were normal in B-TG mice. Splenocytes were stained with anti-IgM, -IgD, -CD21, and -CD23 and assessed by flow cytometry (percentages of gated populations are shown; see also Table S1). B–D are representative of at least three independent experiments.
Figure 2.
Figure 2.
Fc-mediated proliferation, ERK phosphorylation, and CD86 expression are suppressed in B-TG B cells. (A) Proliferation of B cells from B-TG and B-NTG mice after 72 h of activation with either intact anti-IgM or anti-IgM F(ab′)2 antibodies, with and without IL-4, assessed by [3H]thymidine incorporation. (B) CFSE staining of B cells from B-NTG and B-TG mice after activation with varying concentrations of either intact anti-IgM or anti-IgM F(ab′)2 antibodies for 120 h before analysis by flow cytometry. (C) Assessment of ERK phosphorylation by intracellular flow cytometry after B cell activation for 1 min with either anti-IgM intact or anti-IgM F(ab′)2 antibodies (PMA = positive control; dashed lines indicate the gate used to quantify the extent of pERK, as shown in Fig. S4). (D) CD86 expression on B-NTG and B-TG B cells after activation with anti-IgM intact or anti-IgM F(ab′)2 molecules for 48 h, analyzed by flow cytometry. Error bars in A represent SD of triplicate wells from three pooled mice; error bars in D represent SD of three mice. p-values were calculated by the Students t test. A is representative of three independent experiments; B, C, and D are representative of two independent experiments.
Figure 3.
Figure 3.
Overexpression of FcγRIIb on B cells suppresses the T-dependent IgG immune response. (A) Total IgG and IgM titers were measured in serum from naive B-NTG and B-TG mice. Values were calculated from a standard curve of known Ig concentration. Mice were immunized intraperitoneally with NP-haptenated carriers in alum, and antibody responses were assessed by ELISA. B-TG and B-NTG mice were injected with either T-independent (B, NP-ficoll) or T-dependent (C, NP-CGG) antigens and boosted on day 40 with NP-CGG alone or NP-KLH (D). Serum was then assessed for total anti-NP12 IgM and IgG production at various time points after immunization. (E) The affinity of anti-NP IgG was assessed by calculating the ratio of anti-NP2 (high affinity)/anti-NP12 (total) IgG (NP2/NP12) by ELISA from serum obtained from B-NTG and B-TG mice immunized with NP-KLH on day 0, boosted on day 40, and bled on day 49. Each symbol shows data from a single mouse, and the horizontal lines represent the mean. p-values were calculated using the Student's t test. A–C are representative of three independent experiments.
Figure 4.
Figure 4.
Generation of M-TG mice overexpressing functional FcγRIIb. (A) The construct used to direct macrophage-specific expression of transgenic FcγRIIb. (B) Western blot, using a V5-specific antibody, of peritoneal macrophages from M-TG (lines 1 and 2) and M-NTG mice to detect the presence of the V5-tagged transgene. All further experiments use line 2. (B) Flow cytometric analysis of transgene expression on F4/80+CD11b+ peritoneal macrophages (gated population shown on dot plot) from M-NTG and M-TG mice. Histograms represent either 2.4G2 (recognizes all FcγRIIb, III, and IV), Ly17.2 (endogenous FcγRIIb-specific), or Ly17.1 (transgenic FcγRIIb-specific) expression (shaded histogram = isotype control). No detectable transgene expression was demonstrated on other cell types (Figs. S5 and S6). (D) Intracellular calcium measurements in M-NTG and M-TG peritoneal macrophages after FcγRIIb cross-linking (arrow). Inset shows mean peak and plateau calcium responses. (E) Measurements of ERK phosphorylation in peritoneal macrophages from M-NTG, M-TG, and FcγRIIb−/− mice after FcγRIIb cross-linking. The percent increase in pERK-positive cells after stimulation is shown. Error bars represent the SD of triplicate samples from three or four pooled mice. p-values were calculated using the Student's t test. D and E are representative of two and three independent experiments, respectively.
Figure 5.
Figure 5.
Suppressed severity of CIA in B-TG but not M-TG mice. (A) Cumulative arthritis incidence and (B) mean clinical scores (±SEM) for B-TG (n = 14) compared with B-NTG (n = 13) mice over 74 d. (C) Cumulative arthritis incidence and (D) mean clinical scores (±SEM) for M-TG (n = 32) compared with M-NTG (n = 38) mice (data represent three independent experiments combined). p-values for clinical scores were calculated using the unpaired Student's t test. *, P < 0.05; no significant differences were detected in the incidence by χ2 analysis. (E and F) Circulating levels of CII-specific antibody were determined in individual sera by ELISA. Results show mean total IgG and IgM levels (±SEM) as arbitrary units per milliliter (levels of IgG isotypes are shown in Fig. S8). (G and H) At the end of the study, paws were processed for histology and scored blinded for signs of arthritis. Data represent mean ± SEM.
Figure 6.
Figure 6.
Protection from lupus in B-TG mice. B-TG and M-TG mice were crossed with MRL/lpr mice and spontaneous lupus was monitored for up to 40 wk of age. (A and B) Survival rates are shown for groups of B-TG (n = 8), B-NTG (n = 10), M-TG (n = 12), and M-NTG (n = 21) mice. (C and D) Proteinuria levels were recorded weekly in all mice throughout the study. Data are presented as mean ± SEM. p-values were calculated using the unpaired Student's t test. *, P < 0.05. (E) All mice were screened for serum levels of ANA at 20–24 wk of age using Hep-2 slides, and representative results for B-NTG and B-TG mice are shown. (F and G) Serum from each mouse was analyzed for anti-dsDNA IgG. Each symbol represents an individual mouse. Error bars represent SEM. p-values were calculated using the χ2 test (A and B) and the Student's t test (all other values).
Figure 7.
Figure 7.
M-TG mice are more susceptible to pneumococcal infection. Survival after S. pneumoniae infection. (A) Groups of B-TG (n = 8) and B-NTG (n = 11) mice were inoculated intraperitoneally with 2 × 10⁴ CFU S. pneumoniae type 2 (D39). (B) Peritoneal macrophages were incubated with Alexa Fluor 488–labeled S. pneumoniae either unopsonized or opsonized with heat-inactivated immune serum, followed by flow cytometric analysis. Antibody-dependent phagocytosis is expressed as the percentage of Alexa Fluor 488+ cells relative to the nonopsonized sample. Error bars represent SD of three mice per group and are representative of four independent experiments. (C) Groups of M-TG (n = 8) and M-NTG (n = 9) mice were inoculated intraperitoneally with 102 CFU S. pneumoniae type 2 (D39). A significant reduction in survival was observed for the M-TG mice (P = 0.02). (D) Graphical representation of data pooled from five separate infection experiments (including C) using various doses of S. pneumoniae (3 × 101, 102, 104, 106, and 107). Data represent mean ± SEM. The kinetics differ depending on dose; to normalize for this, data are shown as survival at the time point before 100% mortality of the M-TG mice (indicated by the gray box in C). (E) Intranasal infection of M-NTG (n = 11) and M-TG (n = 10) mice with 2 × 10⁶ CFU S. pneumoniae type 2 (D39). p-values were calculated using the Student's t test (B and D) and the log-rank test (C).

References

    1. Nimmerjahn, F., and J.V. Ravetch. 2006. Fcgamma receptors: old friends and new family members. Immunity. 24:19–28. - PubMed
    1. Ravetch, J.V., and S. Bolland. 2001. IgG Fc receptors. Annu. Rev. Immunol. 19:275–290. - PubMed
    1. Xiang, Z., A.J. Cutler, R.J. Brownlie, K. Fairfax, K.E. Lawlor, E. Severinson, E.U. Walker, R.A. Manz, D.M. Tarlinton, and K.G.C. Smith. 2007. FcgammaRIIb controls bone marrow plasma cell persistence and apoptosis. Nat. Immunol. 8:419–429. - PubMed
    1. Takai, T., M. Ono, M. Hikida, H. Ohmori, and J.V. Ravetch. 1996. Augmented humoral and anaphylactic responses in Fc gamma RII-deficient mice. Nature. 379:346–349. - PubMed
    1. Takai, T. 2005. Fc receptors and their role in immune regulation and autoimmunity. J. Clin. Immunol. 25:1–18. - PubMed

Publication types

MeSH terms