. 2008 Apr 14;205(4):853-68.
doi: 10.1084/jem.20072619. Epub 2008 Mar 24.

Phospholipase C-gamma2 and Vav cooperate within signaling microclusters to propagate B cell spreading in response to membrane-bound antigen

Affiliations

Phospholipase C-gamma2 and Vav cooperate within signaling microclusters to propagate B cell spreading in response to membrane-bound antigen

Michele Weber et al. J Exp Med. .

Erratum in

  • J Exp Med. 2008 May 12;205(5):1243

Abstract

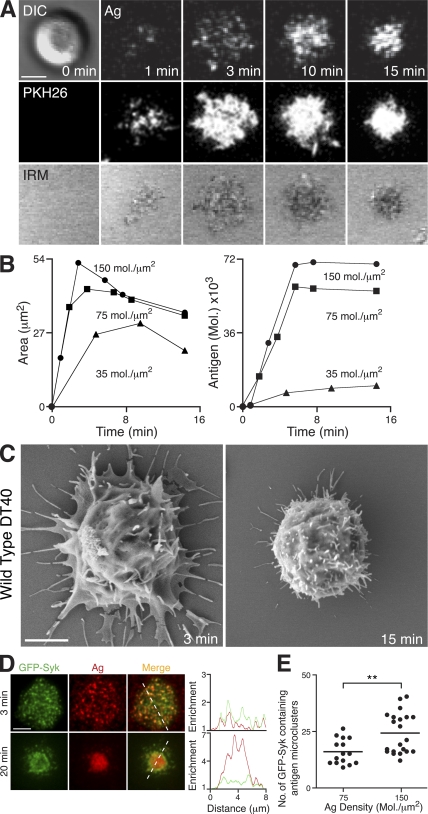
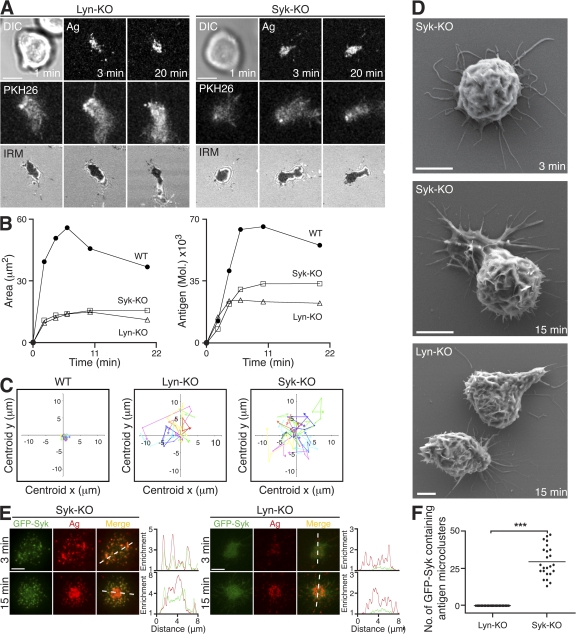
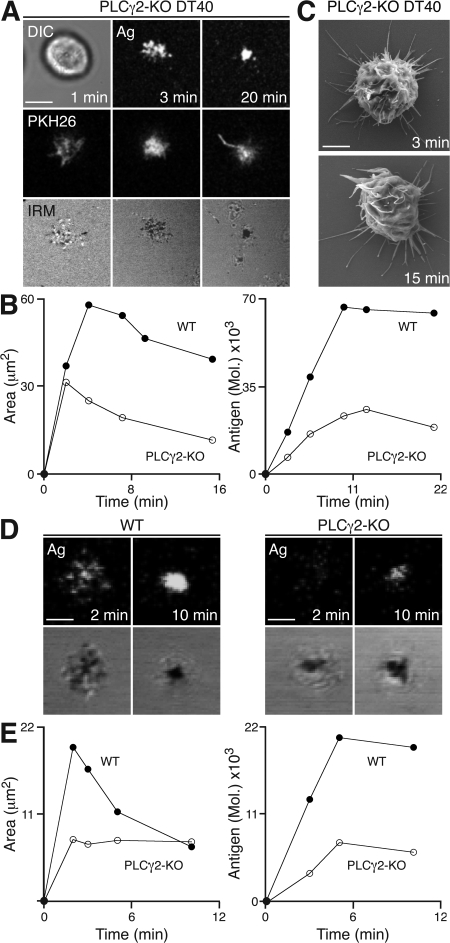
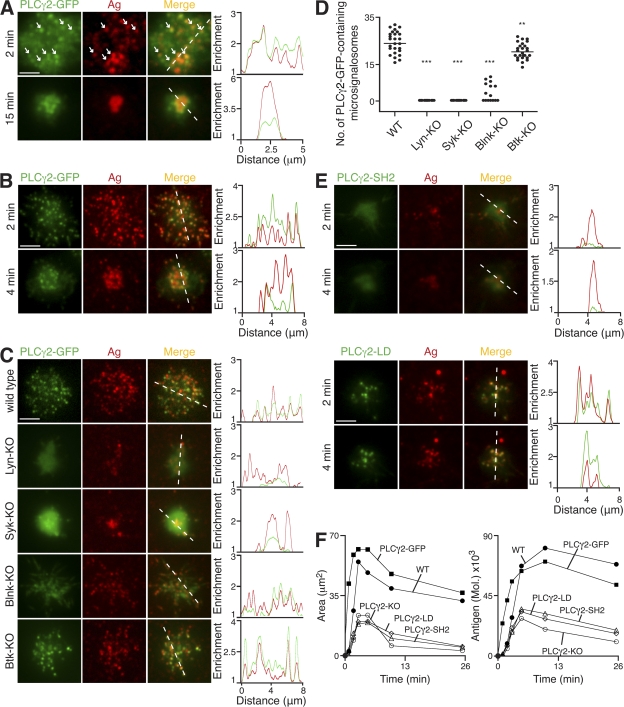
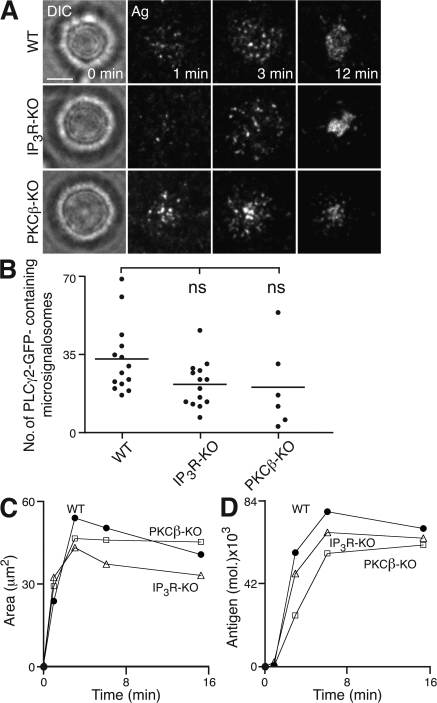
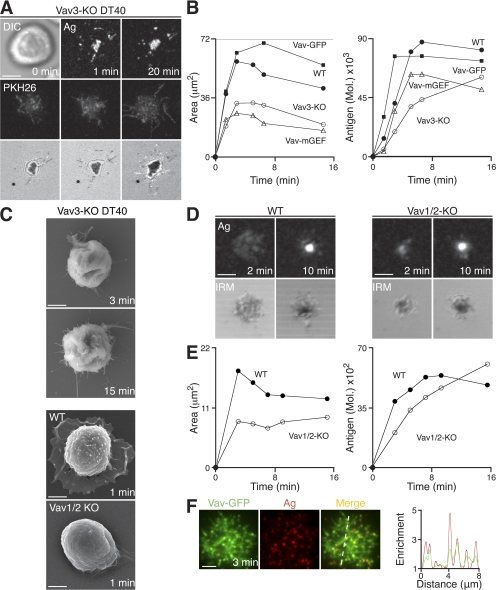
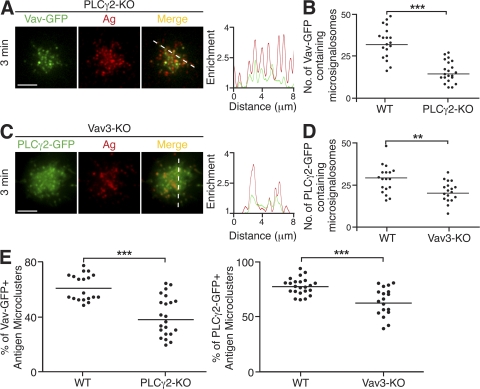
B cell receptor (BCR) recognition of membrane-bound antigen initiates a spreading and contraction response, the extent of which is controlled through the formation of signaling-active BCR-antigen microclusters and ultimately affects the outcome of B cell activation. We followed a genetic approach to define the molecular requirements of BCR-induced spreading and microcluster formation. We identify a key role for phospholipase C-gamma2 (PLCgamma2), Vav, B cell linker, and Bruton's tyrosine kinase in the formation of highly coordinated "microsignalosomes," the efficient assembly of which is absolutely dependent on Lyn and Syk. Using total internal reflection fluorescence microscopy, we examine at high resolution the recruitment of PLCgamma2 and Vav to microsignalosomes, establishing a novel synergistic relationship between the two. Thus, we demonstrate the importance of cooperation between components of the microsignalosome in the amplification of signaling and propagation of B cell spreading, which is critical for appropriate B cell activation.


Figures

Figure 1.
Figure 1.
DT40 B cells as a model system to examine cellular responses to membrane-bound antigen. (A–C) DT40 B cells were settled onto bilayers containing anti-IgM as antigen (Ag). (A, top) DIC (left) and confocal microscopy (right) visualizing antigen. (A, middle) Confocal microscopy visualizing B cell membrane (PKH26). (A, bottom) IRM visualizing contact area. Bar, 5 μm. (B) Bilayer antigen density was varied, as depicted, and (left) contact area by IRM and (right) antigen accumulation were quantified. (C) SEM images. Bar, 2 μm. (D and E) DT40 B cells expressing GFP-Syk (green) were settled on bilayers containing anti-IgM (red) as antigen (Ag). (D) TIRFM images. Relative fluorescence intensity plots of GFP-Syk and antigen are depicted by the diagonal dashed lines. Bar, 5 μm. (E) Quantification of GFP-Syk–containing antigen microclusters after 3 min at the indicated antigen densities. Data represent two independent experiments. The number of antigen microclusters containing GFP-Syk was counted in at least 15 cells of each cell type, representing a total of 779 microclusters. Mean numbers for high and low antigen density are 25 ± 2 and 17.4 ± 1, respectively. **, P < 0.005. Videos 1 and 2 are available at http://www.jem.org/cgi/content/full/jem.20072619/DC1.
Figure 2.
Figure 2.
Lyn and Syk in the initiation of B cell spreading in response to membrane-bound antigen. (A–F) DT40 B cells were settled onto bilayers containing anti-IgM as antigen (Ag; red). (A) Lyn-KO and Syk-KO are shown. (top) DIC (left) and confocal microscopy (right) visualizing antigen. (middle) Confocal microscopy visualizing B cell membrane (PKH26). (bottom) IRM. Bars, 5 μm. (B) Quantification of (left) contact area by IRM and (right) antigen accumulation. (C) Two-dimensional tracking of individual WT, Lyn-KO, and Syk-KO cells. (D) SEM images. Bars, 2 μm. (E) TIRFM images of GFP-Syk (green) expressed in reconstituted Syk-KO and Lyn-KO. Relative fluorescence intensity plots to indicate the distribution of antigen and GFP-Syk are depicted by the diagonal dashed lines. Bars, 5 μm. (F) Quantification of GFP-Syk–containing antigen microclusters present after 3 min of interaction in reconstituted Syk-KO and Lyn-KO DT40 B cells. Data are from two experiments, and the number of antigen microclusters containing GFP-Syk was counted in 24–37 cells, representing a total of 698 microclusters. The mean numbers for reconstituted Syk-KO and Lyn-KO are 29 ± 2 and 0, respectively. ***, P < 0.0001. Video 3 is available at http://www.jem.org/cgi/content/full/jem.20072619/DC1.
Figure 3.
Figure 3.
PLCγ2 is critical for the propagation of cell spreading in response to membrane-bound antigen. (A–E) B cells were settled onto bilayers containing anti-IgM (A–C) and anti-κ (D and E) as antigen (Ag). (A–C) PLCγ2-KO DT40 B cells. (A, top) DIC (left) and confocal microscopy (right) visualizing antigen. (middle) Confocal microscopy visualizing B cell membrane (PKH26). (bottom) IRM. Bar, 5 μm. (B) Quantification of (left) contact area by IRM and (right) antigen accumulation. (C) SEM images. Bar, 5 μm. (D and E) Naive WT (PLCγ2+/+CD19Cre+/−) and PLCγ2-KO (PLCγ2flox/floxCD19Cre+/−) cells. (D, top) Confocal microscopy visualizing antigen distribution. (bottom) IRM. Bars, 2.5 μm. (E) Quantification of (left) contact area by IRM and (right) antigen accumulation. Video 4 is available at http://www.jem.org/cgi/content/full/jem.20072619/DC1.
Figure 4.
Figure 4.
Molecular requirements for PLCγ2 recruitment to antigen microclusters. (A–F) B cells were settled onto bilayers containing anti-κ (A) and anti-IgM (B–F) as antigen (Ag; red). (A–C and E) TIRFM images. Relative fluorescence intensity plots to indicate the distribution of antigen and various PLCγ2-GFP proteins (green) are depicted by the diagonal dashed lines. (A) Primary B cells from PLCγ2-GFP knock-in mice. White arrows identify selected antigen microclusters containing PLCγ2-GFP. (B) PLCγ2-KO DT40 B cells stably expressing PLCγ2-GFP. (C) WT, Lyn-KO, Syk-KO, Blnk-KO, and Btk-KO DT40 B cells expressing PLCγ2-GFP (green) after 3 min. (D) Quantification of PLCγ2-GFP–containing microsignalosomes present in WT, Lyn-KO, Syk-KO, Blnk-KO, and Btk-KO DT40 B cells after 3 min. Data are representative of two experiments, and the number of antigen microclusters containing PLCγ2-GFP was measured in 15–27 cells of each cell type, representing a total of 1,344 microclusters. Mean numbers are as follows: WT, 25 ± 1; Lyn-KO, 0; Syk-KO, 0; Blnk-KO, 3 ± 1; and Btk-KO, 21 ± 1. **, P < 0.005; ***, P < 0.0001. (E) PLCγ2-KO DT40 B cells stably expressing (top) PLCγ2-GFP with mutated SH2 domains (PLCγ2-SH2) or (bottom) PLCγ2-LD-GFP (PLCγ2-LD). (F) Quantification of (left) contact area by confocal microscopy and (right) antigen accumulation. Bars: (A) 2.5 μm; (B, C, and E) 5 μm. Videos 5–7 are available at http://www.jem.org/cgi/content/full/jem.20072619/DC1.
Figure 5.
Figure 5.
PLCγ2-mediated B cell spreading and antigen aggregation in the absence of IP3R or PKCβ. (A–C) WT, IP3R-KO, or PKCβ-KO DT40 B cells were settled onto bilayers containing anti-IgM as antigen (Ag). (A) Brightfield (left) and TIRFM (right) visualizing antigen. Bar, 5 μm. (B) Quantification of PLCγ2-GFP–containing microsignalosomes present after 3 min. Data are representative of two experiments, and the number of microsignalosomes was measured in 6–14 cells, representing a total of 892 microsignalosomes. Mean numbers are as follows: WT, 33 ± 4; IP3R-KO, 22 ± 3; and PKCβ-KO, 21 ± 8. ns, not significantly different. (C) Quantification of (left) contact area by confocal microscopy and (right) antigen accumulation.
Figure 6.
Figure 6.
Vav is required for B cell spreading. (A–F) B cells were settled onto bilayers containing anti-IgM and HEL as antigen (Ag) for DT40 and primary B cells, respectively. (A) Vav3-KO DT40 B cells. (top) DIC (left) and confocal microscopy (right) visualizing antigen. (middle) Confocal microscopy visualizing B cell membrane (PKH26). (bottom) IRM. Bar, 5 μm. (B) WT, Vav3-KO, Vav3-KO expressing Vav-GFP, and Vav3-KO expressing Vav with mutated GEF activity DT40 B cells. Quantification of (left) contact area by IRM and (right) antigen accumulation. (C) SEM images. Bars, 2 μm. (D and E) Primary MD4-HEL-Tg (WT) and Vav1/2-KO HEL-Tg (Vav1/2-KO) splenic B cells. (D, top) Confocal microscopy visualizing antigen. (bottom) IRM. Bars, 2.5 μm. (E) Quantification of (left) contact area by IRM and (right) antigen accumulation. (F) TIRFM images of DT40 B cells expressing Vav-GFP (green) after 3 min. Bar, 5 μm. A relative fluorescence intensity plot to indicate the distribution of Vav-GFP (green) and antigen (red) is depicted by the diagonal dashed line. Video 9 is available at http://www.jem.org/cgi/content/full/jem.20072619/DC1.
Figure 7.
Figure 7.
PLCγ2 and Vav act in concert in the coordination of B cell spreading in response to membrane-bound antigen. (A–E) B cells were settled onto bilayers containing anti-IgM as antigen (Ag; red) and were analyzed after 3 min. (A and B) PLCγ2-KO DT40 B cells expressing Vav-GFP (green). (A) TIRFM images. A relative fluorescence intensity plot to indicate the distribution of Vav-GFP and antigen is depicted by the diagonal dashed line. Bar, 5 μm. (B) Quantification of Vav-GFP–containing microsignalosomes. Data are representative of two experiments, and the number of antigen microclusters containing Vav-GFP was measured in 15–20 cells of each type, representing a total of 934 microsignalosomes. Mean numbers in WT and PLCγ2-KO are 36 ± 3 and 18 ± 2, respectively. ***, P < 0.001. (C and D) Vav3-KO DT40 B cells expressing PLCγ2-GFP (green). (C) TIRFM images. A relative fluorescence intensity plot to indicate the distribution of PLCγ2-GFP and antigen is depicted by the diagonal dashed line. Bar, 5 μm. (D) Quantification of PLCγ2-GFP–containing microsignalosomes. Data are representative of two experiments, and the number of microsignalosomes containing PLCγ2-GFP was measured in 18–23 cells of each cell type, representing a total of 1,061 microsignalosomes. Mean numbers in WT and Vav3-KO are 32 ± 3 and 22 ± 6, respectively. **, P < 0.005. (E) Quantification of (left) Vav-GFP–containing antigen microclusters in WT and PLCγ2-KO DT40 B cells and (right) PLCγ2-GFP–containing antigen microclusters in WT and Vav3-KO DT40 B cells, expressed as a percentage of total antigen microclusters present. Data are representative of two experiments, and the percentage of antigen microclusters was measured in 15–23 cells of each cell type, representing a total of 1,476–1,811 antigen microclusters. (left) Mean percentages in WT and PLCγ2-KO are 62 ± 3 and 43 ± 2, respectively. ***, P < 0.001. (right) Mean percentages in WT and Vav3-KO are 78 ± 2 and 64 ± 3, respectively. ***, P = 0.0001.

Similar articles

Cited by

References

    1. Dal Porto, J.M., S.B. Gauld, K.T. Merrell, D. Mills, A.E. Pugh-Bernard, and J. Cambier. 2004. B cell antigen receptor signaling 101. Mol. Immunol. 41:599–613. - PubMed
    1. Reth, M., and J. Wienands. 1997. Initiation and processing of signals from the B cell antigen receptor. Annu. Rev. Immunol. 15:453–479. - PubMed
    1. DeFranco, A.L. 1997. The complexity of signaling pathways activated by the BCR. Curr. Opin. Immunol. 9:296–308. - PubMed
    1. Fruman, D.A., A.B. Satterthwaite, and O.N. Witte. 2000. Xid-like phenotypes: a B cell signalosome takes shape. Immunity. 13:1–3. - PubMed
    1. DeFranco, A.L. 2001. Vav and the B cell signalosome. Nat. Immunol. 2:482–484. - PubMed

Publication types

MeSH terms