. 2008 Mar 24;168(6):632-42.
doi: 10.1001/archinte.168.6.632.

Treatment success in cancer: new cancer treatment successes identified in phase 3 randomized controlled trials conducted by the National Cancer Institute-sponsored cooperative oncology groups, 1955 to 2006

Affiliations

Treatment success in cancer: new cancer treatment successes identified in phase 3 randomized controlled trials conducted by the National Cancer Institute-sponsored cooperative oncology groups, 1955 to 2006

Benjamin Djulbegovic et al. Arch Intern Med. .

Abstract

Background: The evaluation of research output, such as estimation of the proportion of treatment successes, is of ethical, scientific, and public importance but has rarely been evaluated systematically. We assessed how often experimental cancer treatments that undergo testing in randomized clinical trials (RCTs) result in discovery of successful new interventions.

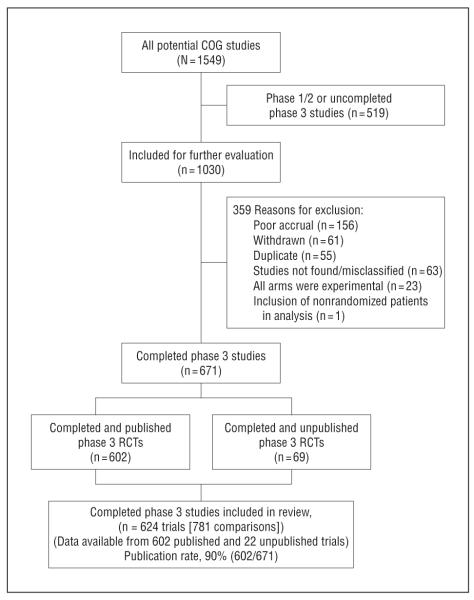
Methods: We extracted data from all completed (published and unpublished) phase 3 RCTs conducted by the National Cancer Institute cooperative groups since their inception in 1955. Therapeutic successes were determined by (1) assessing the proportion of statistically significant trials favoring new or standard treatments, (2) determining the proportion of the trials in which new treatments were considered superior to standard treatments according to the original researchers, and (3) quantitatively synthesizing data for main clinical outcomes (overall and event-free survival).

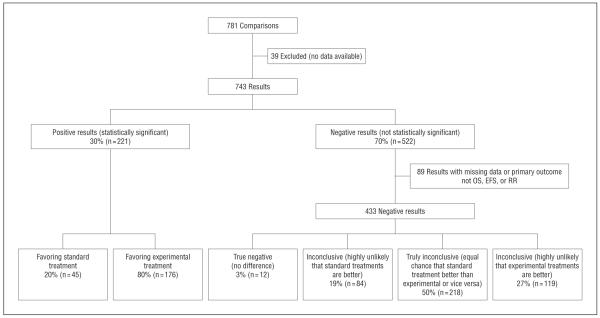
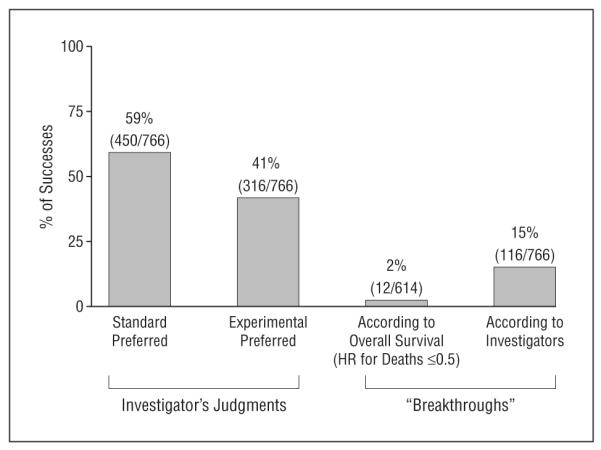
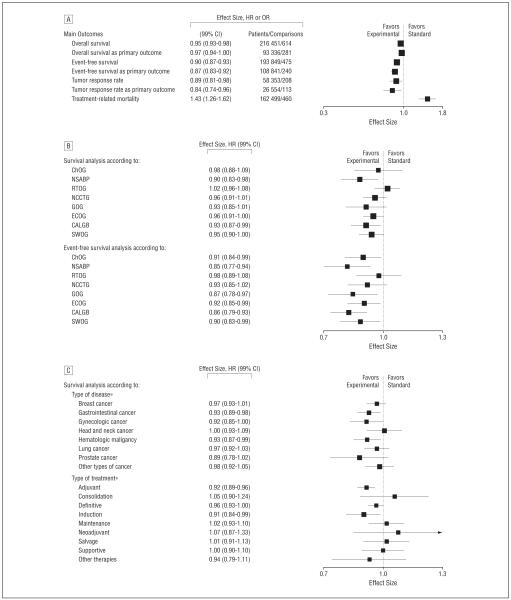
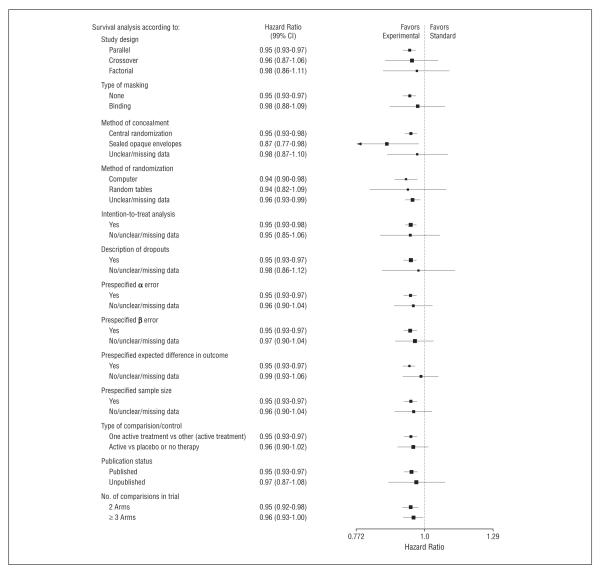
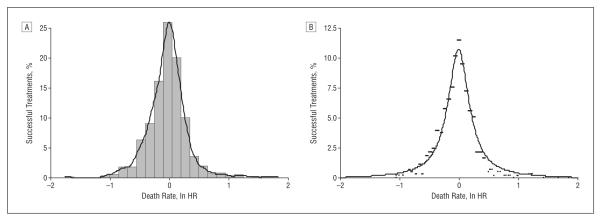
Results: Data from 624 trials (781 randomized comparisons) involving 216 451 patients were analyzed. In all, 30% of trials had statistically significant results, of which new interventions were superior to established treatments in 80% of trials. The original researchers judged that the risk-benefit profile favored new treatments in 41% of comparisons (316 of 766). Hazard ratios for overall and event-free survival, available for 614 comparisons, were 0.95 (99% confidence interval [CI], 0.93-0.98) and 0.90 (99% CI, 0.87- 0.93), respectively, slightly favoring new treatments. Breakthrough interventions were discovered in 15% of trials.

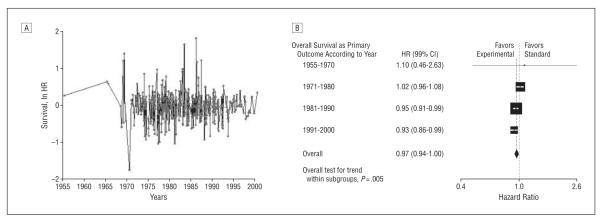
Conclusions: Approximately 25% to 50% of new cancer treatments that reach the stage of assessment in RCTs will prove successful. The pattern of successes has become more stable over time. The results are consistent with the hypothesis that the ethical principle of equipoise defines limits of discoverability in clinical research and ultimately drives therapeutic advances in clinical medicine.


Figures

Figure 1
Figure 1
Inclusion of trials and publication rate. COG indicates cooperative group; RCT, randomized controlled trial.
Figure 2
Figure 2
Distribution of outcomes by statistical significance of results according to primary outcome. EFS indicates event-free survival; OS, overall survival; and RR, response rate.
Figure 3
Figure 3
Distribution of outcomes according to the published judgment of the original researchers. “Breakthrough” treatments were defined as those that should replace the existing standard of care or that reduced the death rate by 50% or more. HR indicates hazard ratio.
Figure 4
Figure 4
Evaluation of treatment successes. A, Meta-analysis of main outcomes. B, Overall survival and event-free survival according to cooperative oncology group. C, Sensitivity analysis according to type of treatment and disease. CALGB indicates Cancer and Leukemia Group B; ChOG, Children’s Oncology Groups; ECOG, Eastern Cooperative Oncology Group; GOG, Gynecological Oncology Group; NCCTG, Northern Central Cancer Treatment Group; NSABP, National Surgical Adjuvant Breast and Bowel Project; RTOG, Radiation Therapy Oncology Group; and SWOG, Southwest Oncology Group. Hazard ratios (HRs) are given for time to event data (overall survival and event-free survival) and odds ratios (ORs) for dichotomous data (response rate and treatment-related mortality). Vertical lines indicate lines of no difference between new and standard treatments. Note that a “no difference” result can be obtained when treatments are truly identical, or when experimental treatments are as successful as standard treatments (ie, sometimes new treatments are better and sometimes standard treatments are better). Squares indicate point estimates. Horizontal lines represent 99% confidence interval (CI). Asterisks indicate that the test for heterogeneity between subgroups was statistically significant at P=.05.
Figure 5
Figure 5
Sensitivity analysis according to the most important methodologic domains. Vertical lines indicate lines of no difference between new and standard treatments. Note that a “no difference” result can be obtained when treatments are truly identical, or when experimental treatments are as successful as standard treatments (ie, sometimes new treatments are better and sometimes standard treatments are better). Squares indicate point estimates. Horizontal lines represent 99% confidence interval (CI).
Figure 6
Figure 6
Assessment of the pattern of treatment successes over time. A, Time series analysis of treatment effect (natural logarithm of hazard ratio [ln HR]) performed by the National Cancer Institute cooperative oncology groups. “White noise” pattern indicates no significant autocorrelation between studies carried out at various time intervals. An ln HR less than 0 indicates superiority of new treatments; greater than 0, superiority of standard treatments. B, Subgroup analysis stratified by time periods, showing a slight improvement in overall survival over time, unlikely to be clinically meaningful (P for trend=.005). Vertical lines indicate lines of no difference between new and standard treatments. Note that a “no difference” result can be obtained when treatments are truly identical, or when experimental treatments are as successful as standard treatments (ie, sometimes new treatments are better and sometimes standard treatments are better). Squares indicate point estimates. Horizontal lines represent 99% confidence interval (CI).
Figure 7
Figure 7
Subgroup analysis stratified by time according to type of treatment (A) and type of disease (B). Vertical lines indicate lines of no difference between new and standard treatments. Note that a “no difference” result can be obtained when treatments are truly identical, or when experimental treatments are as successful as standard treatments (ie, sometimes new treatments are better and sometimes standard treatments are better). Squares indicate point estimates. Horizontal lines represent 99% confidence interval (CI).
Figure 8
Figure 8
Distribution of treatment success in oncology. A, Although the data resemble normal distribution, the curve significantly deviates from normality (Shapiro-Wilks test: z=7.97; P<.001). B, The best fit was accomplished by using a power law function, y=A/[1+(B×x2)], where y represents the percentage of treatment success with experimental or standard treatment, and x is expressed as natural logarithm of the hazard ratio (ln HR). If ln HR is less than 0, then y predicts success of experimental treatments and vice versa. A=10.76; B=21.87; r2=95%.

Comment in

  • Cooperative groups are not..
    Peters WP. Peters WP. Arch Intern Med. 2008 Oct 27;168(19):2172-3; author reply 2173-4. doi: 10.1001/archinte.168.19.2172-b. Arch Intern Med. 2008. PMID: 18955657 No abstract available.
  • Treatment success in cancer.
    Korn EL, Mooney MM, Abrams JS. Korn EL, et al. Arch Intern Med. 2008 Oct 27;168(19):2173; author reply 2173-4. doi: 10.1001/archinte.168.19.2173-a. Arch Intern Med. 2008. PMID: 18955658 No abstract available.

References

    1. Jemal A, Siegel R, Ward E, Murray T, Xu J, Thun MJ. Cancer statistics, 2007. CA Cancer J Clin. 2007;57(1):43–66. - PubMed
    1. Wittes RE. Therapies for cancer in children: past successes, future challenges. N Engl J Med. 2003;348(8):747–749. - PubMed
    1. Collins R, McMahon S. Reliable assessment of the effects of treatment on mortality and major morbidity, I: clinical trials. Lancet. 2001;357(9253):373–380. - PubMed
    1. Grann A, Grann VR. The case for randomized trials in cancer treatment: new is not always better. JAMA. 2005;293(8):1001–1003. - PubMed
    1. National Cancer Institute 2005 Fact Book. [Accessed April 17, 2007]. http://fmb.cancer.gov/financial/attachments/FY-2005-FACT-BOOK-FINAL.pdf.

Publication types