. 2008 Apr 1;105(13):5213-8.
doi: 10.1073/pnas.0801279105. Epub 2008 Mar 24.

Identification of noninvasive imaging surrogates for brain tumor gene-expression modules

Affiliations

Identification of noninvasive imaging surrogates for brain tumor gene-expression modules

Maximilian Diehn et al. Proc Natl Acad Sci U S A. .

Abstract

Glioblastoma multiforme (GBM) is the most common and lethal primary brain tumor in adults. We combined neuroimaging and DNA microarray analysis to create a multidimensional map of gene-expression patterns in GBM that provided clinically relevant insights into tumor biology. Tumor contrast enhancement and mass effect predicted activation of specific hypoxia and proliferation gene-expression programs, respectively. Overexpression of EGFR, a receptor tyrosine kinase and potential therapeutic target, was also directly inferred by neuroimaging and was validated in an independent set of tumors by immunohistochemistry. Furthermore, imaging provided insights into the intratumoral distribution of gene-expression patterns within GBM. Most notably, an "infiltrative" imaging phenotype was identified that predicted patient outcome. Patients with this imaging phenotype had a greater tendency toward having multiple tumor foci and demonstrated significantly shorter survival than their counterparts. Our findings provide an in vivo portrait of genome-wide gene expression in GBM and offer a potential strategy for noninvasively selecting patients who may be candidates for individualized therapies.


Conflict of interest statement

Conflict of interest statement: M.D.K. has filed a patent application in an area related to this field of work.

Figures

Fig. 1.
Fig. 1.
Gene-expression surrogates for MRI traits. (A) Unsupervised hierarchical clustering of 32 samples including GBMs and normal brain specimens was performed as described (3). Gene clusters with common functional or biological themes were identified and are indicated to the left of the expression map. Rows represent genes (unique cDNA elements), and columns represent experimental samples. By using a correlation-based approach, statistically significant positive associations between MR imaging phenotypes and the gene clusters were identified (see Methods). The imaging trait displaying the best fit for each gene-expression module is indicated to the right of the expression map. Permutation-based P values are shown by using colored bars. Statistical significance is represented in terms of −log10(p), and several cut-off values are indicated. (B) Expanded view of the association between the hypoxia gene-expression module and contrast enhancement. Tumor arrays were clustered by using only cDNA clones contained within the gene module. The value of the imaging trait for each tumor is indicated by the colored box above the expression map. Representative MR images are depicted on the left. A subset of named genes is labeled. (C) Expanded view of the association between the proliferation gene-expression module and mass effect. Data are displayed as in B.
Fig. 2.
Fig. 2.
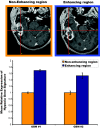
Intratumoral contrast enhancement variability reflects spatial expression of the hypoxia gene-expression module. For two tumors, stereotactic biopsies were performed from contrast enhancing and nonenhancing regions, and gene-expression profiles were generated separately for each biopsy. The bar graphs (Lower) display the mean relative expression of the hypoxia gene-expression signature in each of the biopsied regions. The expression differences between the two regions were statistically significant for both tumors (P < 0.002). Representative MR images of the biopsied regions are depicted (Upper).
Fig. 3.
Fig. 3.
C:N ratio is associated with EGFR protein expression in an independent group of GBMs. EGFR protein levels were assessed by immunohistochemistry (IHC) in an independent set of 49 GBMs for which preoperative MRI scans were available. C:N ratio was scored for each MRI and was found to be significantly associated with EGFR expression (P < 0.004) (A) Representative MRI depicting high C:N ratio. (B) EGFR IHC for the patient in A. (C) Representative MRI depicting low C:N ratio. (D) EGFR IHC for the patient in C.
Fig. 4.
Fig. 4.
The infiltrative/edematous radiophenotype predicts survival of GBM patients. (A) Expression of the infiltrative radiophenotype-associated genes in the initial set of GBMs. Data are displayed as in Fig. 1. (B) Kaplan–Meier analysis based on the infiltrative/edematous radiophenotype for the initial set of GBMs. (C) Kaplan–Meier analysis based on the infiltrative/edematous radiophenotype for an independent cohort of 110 GBM patients. Median overall survival was 390 days for edematous tumors and 216 days for infiltrative tumors (P < 3.1 × 10⁻⁷).

References

    1. Nutt CL, et al. Gene-expression-based classification of malignant gliomas correlates better with survival than histological classification. Cancer Res. 2003;63:1602–1607. - PubMed
    1. Freije WA, et al. Gene-expression profiling of gliomas strongly predicts survival. Cancer Res. 2004;64:6503–6510. - PubMed
    1. Liang Y, et al. Gene-expression profiling reveals molecularly and clinically distinct subtypes of glioblastoma multiforme. Proc Natl Acad Sci USA. 2005;102:5814–5819. - PMC - PubMed
    1. Bredel M, et al. Functional network analysis reveals extended gliomagenesis pathway maps and three novel MYC-interacting genes in human gliomas. Cancer Res. 2005;65:8679–8689. - PubMed
    1. Phillips HS, et al. Molecular subclasses of high-grade glioma predict prognosis, delineate a pattern of disease progression, and resemble stages in neurogenesis. Cancer Cell. 2006;9:157–173. - PubMed

Publication types