. 2008 Apr;40(4):421-9.
doi: 10.1038/ng.113. Epub 2008 Mar 23.

Fine mapping of regulatory loci for mammalian gene expression using radiation hybrids

Affiliations

Fine mapping of regulatory loci for mammalian gene expression using radiation hybrids

Christopher C Park et al. Nat Genet. 2008 Apr.

Erratum in

  • Nat Genet. 2008 May;40(5):682

Abstract

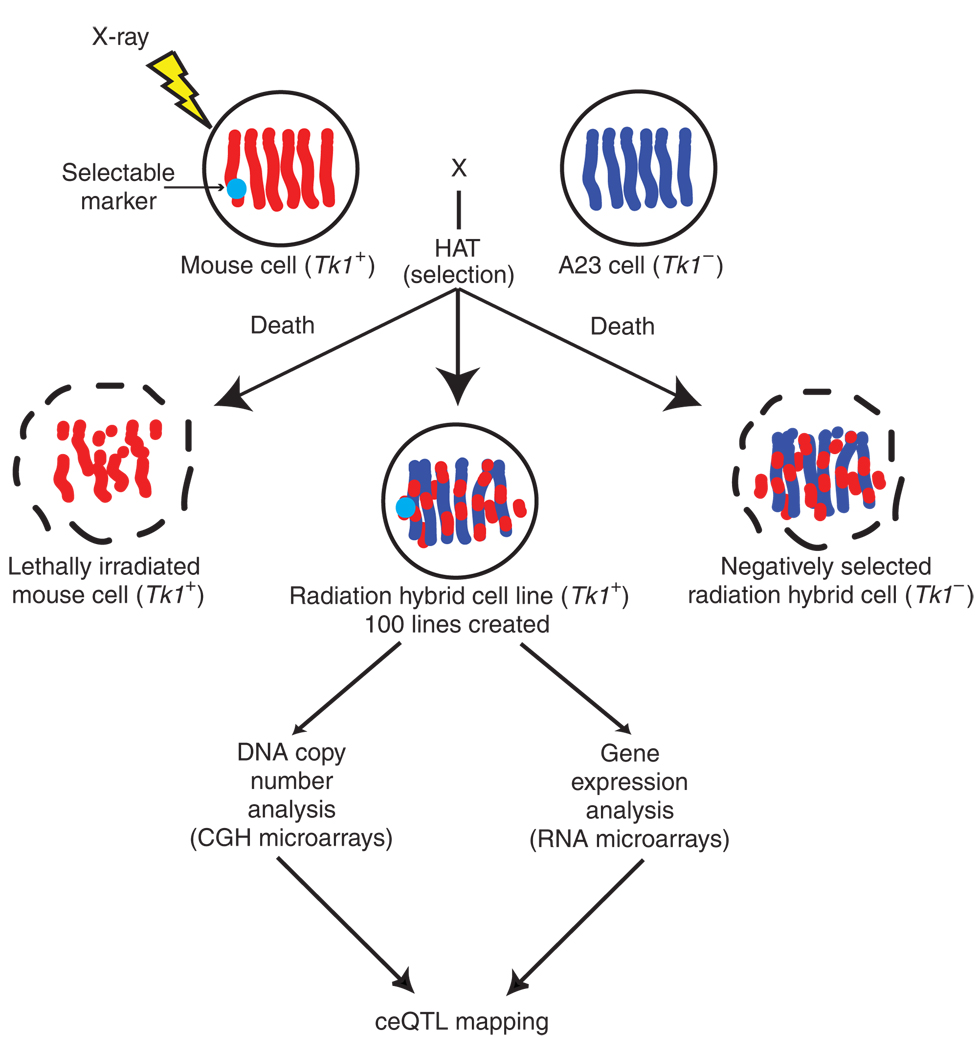
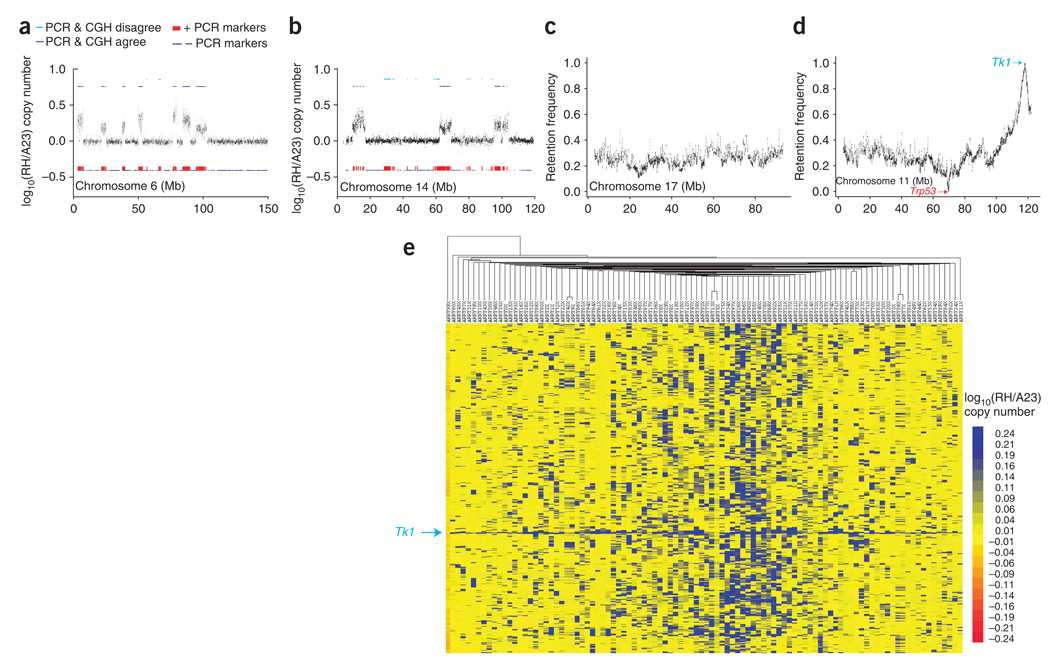
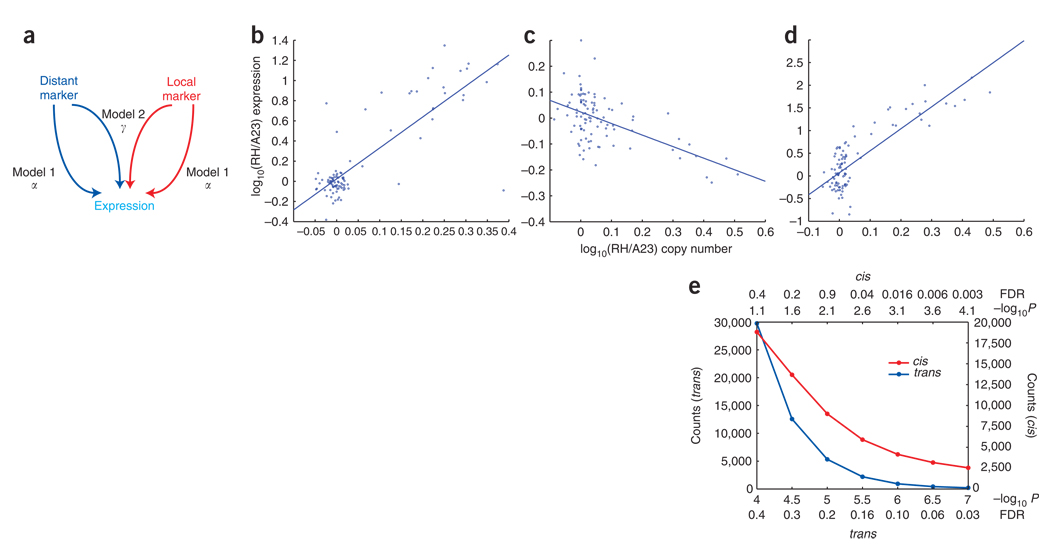
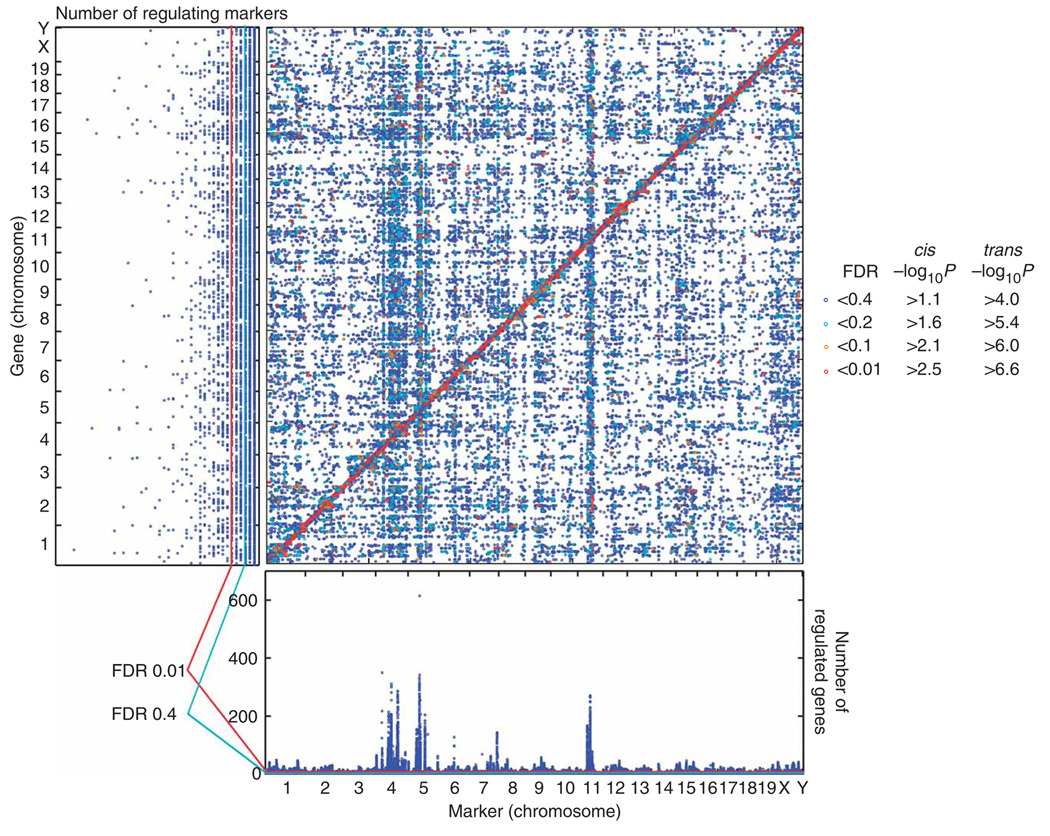
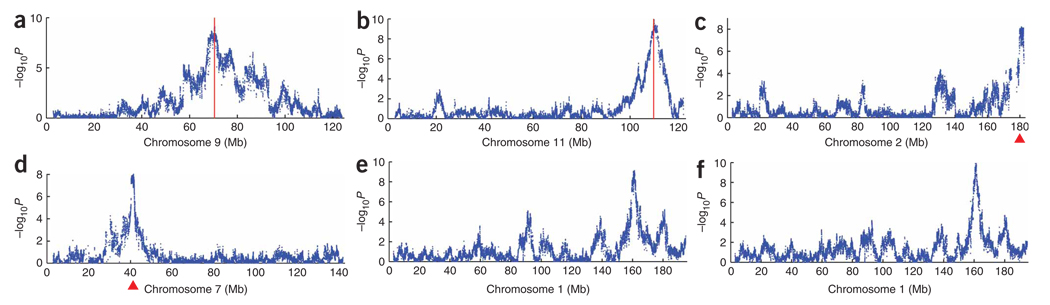
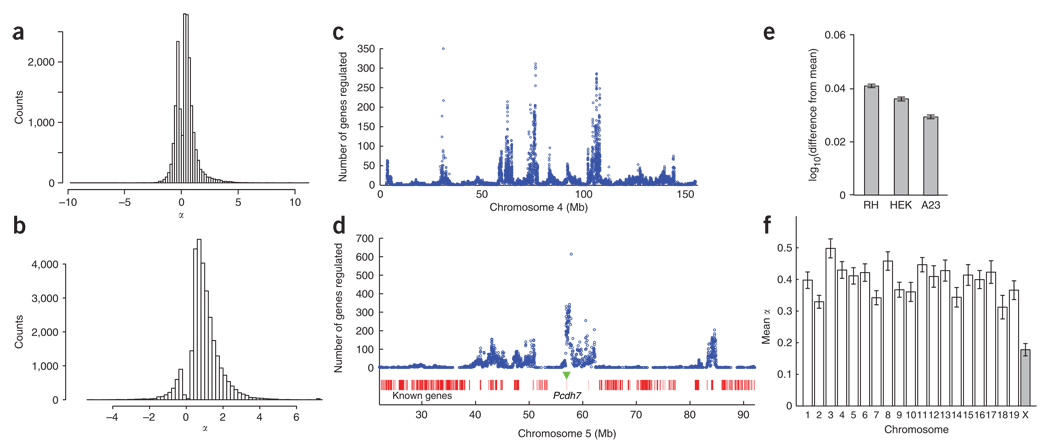
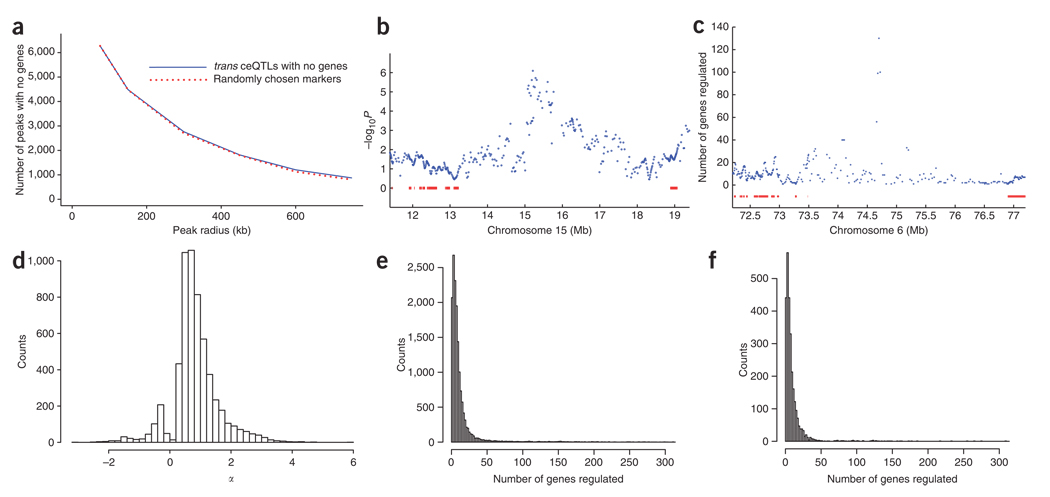
We mapped regulatory loci for nearly all protein-coding genes in mammals using comparative genomic hybridization and expression array measurements from a panel of mouse-hamster radiation hybrid cell lines. The large number of breaks in the mouse chromosomes and the dense genotyping of the panel allowed extremely sharp mapping of loci. As the regulatory loci result from extra gene dosage, we call them copy number expression quantitative trait loci, or ceQTLs. The -2log10P support interval for the ceQTLs was <150 kb, containing an average of <2-3 genes. We identified 29,769 trans ceQTLs with -log10P > 4, including 13 hotspots each regulating >100 genes in trans. Further, this work identifies 2,761 trans ceQTLs harboring no known genes, and provides evidence for a mode of gene expression autoregulation specific to the X chromosome.


Figures

Figure 1
Figure 1
Radiation hybrid and ceQTL mapping (adapted from ref. 14).
Figure 2
Figure 2
CGH results. (a) Data for radiation hybrid clone 26 show only small regions of loss compared to historical PCR genotyping data. (b) Data for clone 15 show more extensive loss. (c) Retention frequency from CGH data for chromosome 17. The retention is relatively constant along the length of the chromosome at ~20%. (d) Retention frequency for chromosome 11, showing 0% retention at Trp53 and 100% retention at Tk1. (e) Clustergram showing an overview of the CGH log10(RH/A23) copy number ratios for the radiation hybrid clones and the A23 recipient cells (left column). The log10 copy number ratio was downsampled 10 to 1 using a jumping window of ten markers averaged to give a single value. The rows represent the resulting log10 copy number ratios for the downsampled markers, in the same order as they appear in the genome. The columns represent the radiation hybrid clones and A23 cells ordered by similarity.
Figure 3
Figure 3
Models. (a) Models 1 and 2. (b) Regression between gene expression and CGH copy number ratio at the peak marker for a trans ceQTL at 78 Mb on chromosome 15 with positive α, regulating the Cded (cell differentiation and embryonic development) gene on chromosome 2. α = 3.075, −log10P = 10.370. (c) Trans ceQTL at 21 Mb on the X chromosome with negative α, regulating the dishevelled homolog 1 (Dvl1) gene on chromosome 4. α = −0.446, −log10P = 6.237. (d) Cis ceQTL for the Copa (coatomer protein complex subunit α) gene on chromosome 1 at 172 Mb has positive α. α = 4.854, −log10P = 10.370. (e) FDRs and −log10P values for cis and trans ceQTLs.
Figure 4
Figure 4
Cis and trans ceQTLs. Marker positions are shown on the horizontal axis, and gene positions are shown on the vertical. Chromosome boundaries are shown on both axes. FDRs < 0.4 are shown. The horizontal marginal distribution represents the sum of the gene numbers regulated in trans at each point and indicates markers regulating many genes (hotspots). The probability that a marker would regulate >6 genes, assuming uniform distribution of trans ceQTLs, was 0.24 (FDR < 0.4), whereas the probability that a marker would regulate >12 genes was 0.002 (FDR < 0.01) (Supplementary Methods). The vertical marginal distribution shows the number of trans ceQTLs regulating each gene and indicates highly regulated genes. The probability that a gene would have >3 trans ceQTLs, assuming the trans ceQTLs were equally distributed across genes, was 0.063 (FDR < 0.4), and the probability it would have >6 trans ceQTLs was 9 × 10⁻⁴ (FDR < 0.01) (Supplementary Methods).
Figure 5
Figure 5
Individual cis and trans ceQTLs. (a) Cis ceQTL for the Ccnb2 gene on chromosome 9 at 71 Mb. Gene position is indicated by red vertical line. Marker position is shown on the horizontal axis in Mb. Each point represents a single marker on the CGH array. (b) Cis ceQTL for the Prkar1a (regulatory subunit IIα of cAMP dependent protein kinase) gene on chromosome 11 at 110 Mb. (c) Trans ceQTL at 180 Mb on chromosome 2 regulating the Chst4 (carbohydrate sulfotransferase 4) gene on chromosome 8. Major trans ceQTL peak is indicated by red triangle. (d) Trans ceQTL at 40 Mb on chromosome 7 regulating the ferritin Ftl1-rs7 gene on chromosome 13. (e) Replicability for a trans ceQTL. Trans ceQTL at 160 Mb on chromosome 1 regulating the Prdx6-rs1 (peroxiredoxin 6, related sequence 1) gene on chromosome 2. Data before the freeze-thaw cycle. (f) Data after the freeze-thaw cycle.
Figure 6
Figure 6
Effect sizes and regulatory hotspots. (a) Counts of cis ceQTLs with FDR < 0.4 versus α. Positive α values represent genes whose expression is increased by an extra copy of the donor mouse gene, whereas negative values represent genes whose expression is decreased. (b) Counts of trans ceQTLs with FDR < 0.4 versus α. (c) Regulatory hotspots on chromosome 4 versus α. (d) Section of chromosome 5 showing hotspot regulating largest number of genes (614) at 56 Mb. The position of Pcdh7 is indicated by a green triangle. (e) Mean expression increase for genes regulated by the chromosome 5 hotspot in the radiation hybrid panel and cells transfected with Pcdh7a compared to cells transfected with empty vector. (f) Mean cis ceQTL α values on the autosomes and X chromosome. Error bars, s.e.m.
Figure 7
Figure 7
Trans ceQTLs lacking known genes. (a) Relationship between number of trans ceQTLs with no genes and radius from peak marker (solid line). Trans ceQTLs regulating >1 gene are counted once only. The same relationship for randomly chosen markers is also shown (broken line). (b) Example of trans ceQTL on chromosome 15 at 15.3 Mb with no known genes underneath regulating the Maoa (monoamine oxidase A) gene on the X chromosome. Known genes are shown as red bars, (c) Example of a trans ceQTL hotspot with no known genes underneath. This trans ceQTL hotspot, located at 74.75 Mb on chromosome 6, regulates 130 genes. (d) Counts of trans loci with no genes and FDR < 0.4 versus α. Trans ceQTLs lacking genes had smaller mean α values than those with genes (0.832 ± 0.01 and 0.986 ± 0.006, respectively, permutation t-test, P < 2 × 10⁻⁵; see also Figure 6b). (e) Counts of trans ceQTLs with FDR < 0.4 versus numbers of regulated genes. (f) Counts of trans ceQTLs with no genes and FDR < 0.4 versus numbers of regulated genes. Fewer mean numbers of genes were regulated by trans ceQTLs lacking genes than by trans ceQTLs with genes (11.35 ± 0.48 and 13.49 ± 0.21 genes, respectively, permutation t-test, P < 2 × 10⁻⁵).

References

    1. Jansen RC, Nap JP. Genetical genomics: the added value from segregation. Trends Genet. 2001;17:388–391. - PubMed
    1. Brem RB, Yvert G, Clinton R, Kruglyak L. Genetic dissection of transcriptional regulation in budding yeast. Science. 2002;296:752–755. - PubMed
    1. Wayne ML, McIntyre LM. Combining mapping and arraying: an approach to candidate gene identification. Proc. Natl. Acad. Sci. USA. 2002;99:14903–14906. - PMC - PubMed
    1. Schadt EE, et al. Genetics of gene expression surveyed in maize, mouse and man. Nature. 2003;422:297–302. - PubMed
    1. Kirst M, et al. Coordinated genetic regulation of growth and lignin revealed by quantitative trait locus analysis of cDNA microarray data in an interspecific backcross of eucalyptus. Plant Physiol. 2004;135:2368–2378. - PMC - PubMed

Associated data