Profiling of experience-regulated proteins in the songbird auditory forebrain using quantitative proteomics
- PMID: 18364021
- PMCID: PMC2517219
- DOI: 10.1111/j.1460-9568.2008.06102.x
Profiling of experience-regulated proteins in the songbird auditory forebrain using quantitative proteomics
Abstract
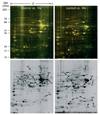
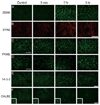
Auditory and perceptual processing of songs are required for a number of behaviors in songbirds such as vocal learning, territorial defense, mate selection and individual recognition. These neural processes are accompanied by increased expression of a few transcription factors, particularly in the caudomedial nidopallium (NCM), an auditory forebrain area believed to play a key role in auditory learning and song discrimination. However, these molecular changes are presumably part of a larger, yet uncharacterized, protein regulatory network. In order to gain further insight into this network, we performed two-dimensional differential in-gel expression (2D-DIGE) experiments, extensive protein quantification analyses, and tandem mass spectrometry in the NCM of adult songbirds hearing novel songs. A subset of proteins was selected for immunocytochemistry in NCM sections to confirm the 2D-DIGE findings and to provide additional quantitative and anatomical information. Using these methodologies, we found that stimulation of freely behaving birds with conspecific songs did not significantly impact the NCM proteome 5 min after stimulus onset. However, following 1 and 3 h of stimulation, a significant number of proteins were consistently regulated in NCM. These proteins spanned a range of functional categories that included metabolic enzymes, cytoskeletal molecules, and proteins involved in neurotransmitter secretion and calcium binding. Our findings suggest that auditory processing of vocal communication signals in freely behaving songbirds triggers a cascade of protein regulatory events that are dynamically regulated through activity-dependent changes in calcium levels.
Figures


Similar articles
-
Blocking estradiol synthesis affects memory for songs in auditory forebrain of male zebra finches.Neuroreport. 2012 Nov 14;23(16):922-6. doi: 10.1097/WNR.0b013e3283588b61. Neuroreport. 2012. PMID: 22955141 Free PMC article.
-
Familiar But Unexpected: Effects of Sound Context Statistics on Auditory Responses in the Songbird Forebrain.J Neurosci. 2017 Dec 6;37(49):12006-12017. doi: 10.1523/JNEUROSCI.5722-12.2017. Epub 2017 Nov 8. J Neurosci. 2017. PMID: 29118103 Free PMC article.
-
Hierarchical emergence of sequence sensitivity in the songbird auditory forebrain.J Comp Physiol A Neuroethol Sens Neural Behav Physiol. 2016 Mar;202(3):163-83. doi: 10.1007/s00359-016-1070-7. Epub 2016 Feb 10. J Comp Physiol A Neuroethol Sens Neural Behav Physiol. 2016. PMID: 26864094
-
A songbird forebrain area potentially involved in auditory discrimination and memory formation.J Biosci. 2008 Mar;33(1):145-55. doi: 10.1007/s12038-008-0030-y. J Biosci. 2008. PMID: 18376079 Review.
-
Song-induced gene expression: a window on song auditory processing and perception.Ann N Y Acad Sci. 2004 Jun;1016:263-81. doi: 10.1196/annals.1298.021. Ann N Y Acad Sci. 2004. PMID: 15313780 Review.
Cited by
-
Discrete molecular states in the brain accompany changing responses to a vocal signal.Proc Natl Acad Sci U S A. 2009 Jul 7;106(27):11364-9. doi: 10.1073/pnas.0812998106. Epub 2009 Jun 18. Proc Natl Acad Sci U S A. 2009. PMID: 19541599 Free PMC article.
-
Proteomic and immunologic analyses of brain tumor exosomes.FASEB J. 2009 May;23(5):1541-57. doi: 10.1096/fj.08-122184. Epub 2008 Dec 24. FASEB J. 2009. PMID: 19109410 Free PMC article.
-
The use of neuroproteomics in drug abuse research.Drug Alcohol Depend. 2010 Feb 1;107(1):11-22. doi: 10.1016/j.drugalcdep.2009.10.001. Epub 2009 Nov 17. Drug Alcohol Depend. 2010. PMID: 19926406 Free PMC article. Review.
-
Auditory proteomics: methods, accomplishments and challenges.Brain Res. 2009 Jun 24;1277:24-36. doi: 10.1016/j.brainres.2009.02.026. Epub 2009 Feb 24. Brain Res. 2009. PMID: 19245797 Free PMC article. Review.
-
Estradiol-dependent modulation of auditory processing and selectivity in songbirds.Front Neuroendocrinol. 2011 Aug;32(3):287-302. doi: 10.1016/j.yfrne.2010.12.002. Epub 2010 Dec 10. Front Neuroendocrinol. 2011. PMID: 21146556 Free PMC article. Review.
References
-
- Alban A, David SO, Bjorkesten L, Andersson C, Sloge E, Lewis S, Currie I. A novel experimental design for comparative two-dimensional gel analysis: two-dimensional difference gel electrophoresis incorporating a pooled internal standard. Proteomics. 2003;3:36–44. - PubMed
-
- Bailey DJ, Wade J. Differential expression of the immediate early genes FOS and ZENK following auditory stimulation in the juvenile male and female zebra finch. Brain Res. Mol. Brain Res. 2003;116:147–154. - PubMed
-
- Bailey DJ, Wade J. FOS and ZENK responses in 45-day-old zebra finches vary with auditory stimulus and brain region, but not sex. Behav. Brain Res. 2005;162:108–115. - PubMed
-
- Bolhuis JJ, Gahr M. Neural mechanisms of birdsong memory. Nat. Rev. Neurosci. 2006;7:347–357. - PubMed
Publication types
MeSH terms
Substances
Grants and funding
LinkOut - more resources
Full Text Sources

