. 2008 May 30;283(22):15300-8.
doi: 10.1074/jbc.M800648200. Epub 2008 Mar 25.

Peroxisomes as novel players in cell calcium homeostasis

Affiliations

Peroxisomes as novel players in cell calcium homeostasis

Francesco Massimo Lasorsa et al. J Biol Chem. .

Abstract

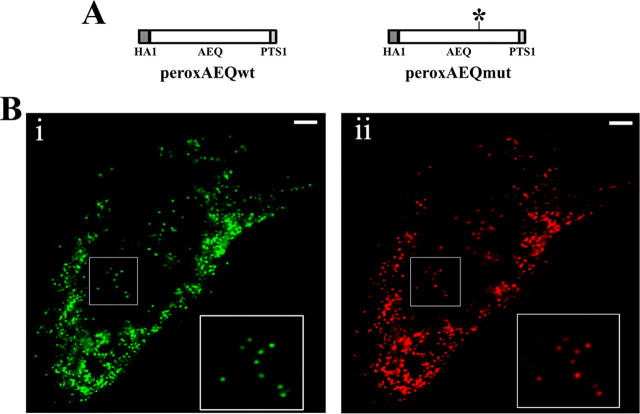
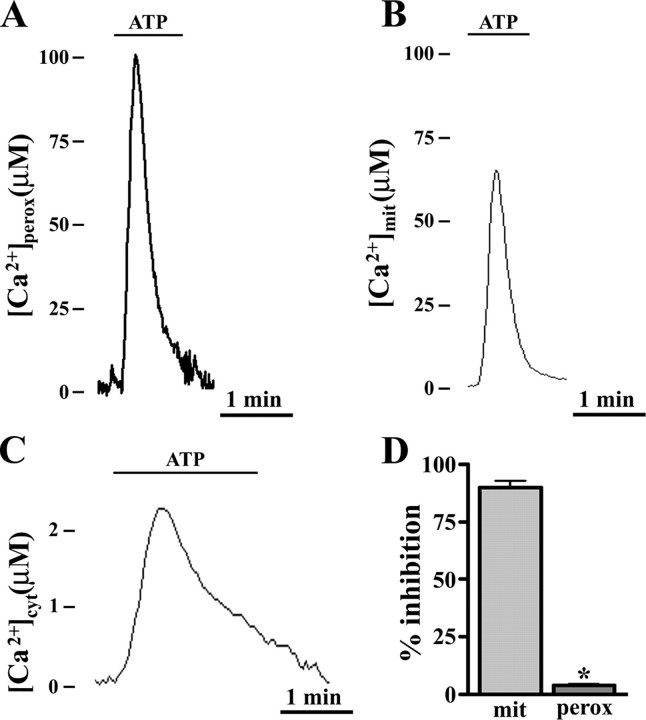
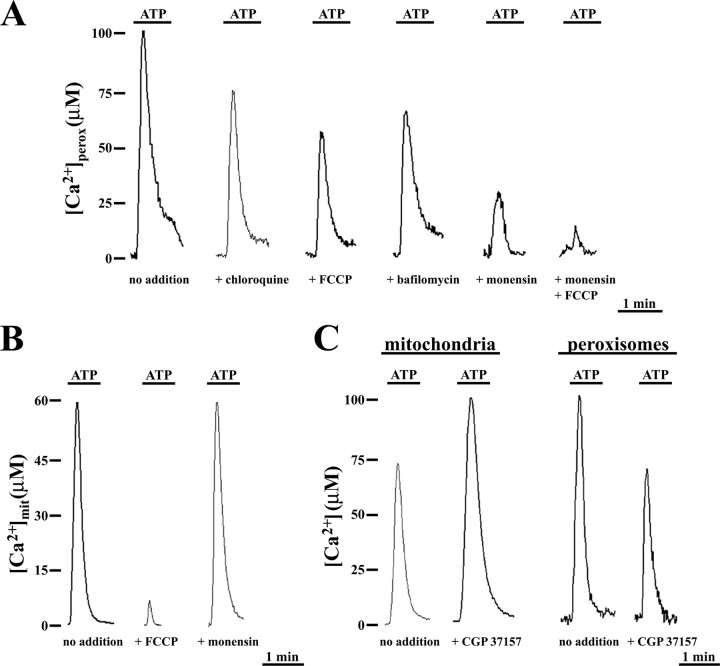
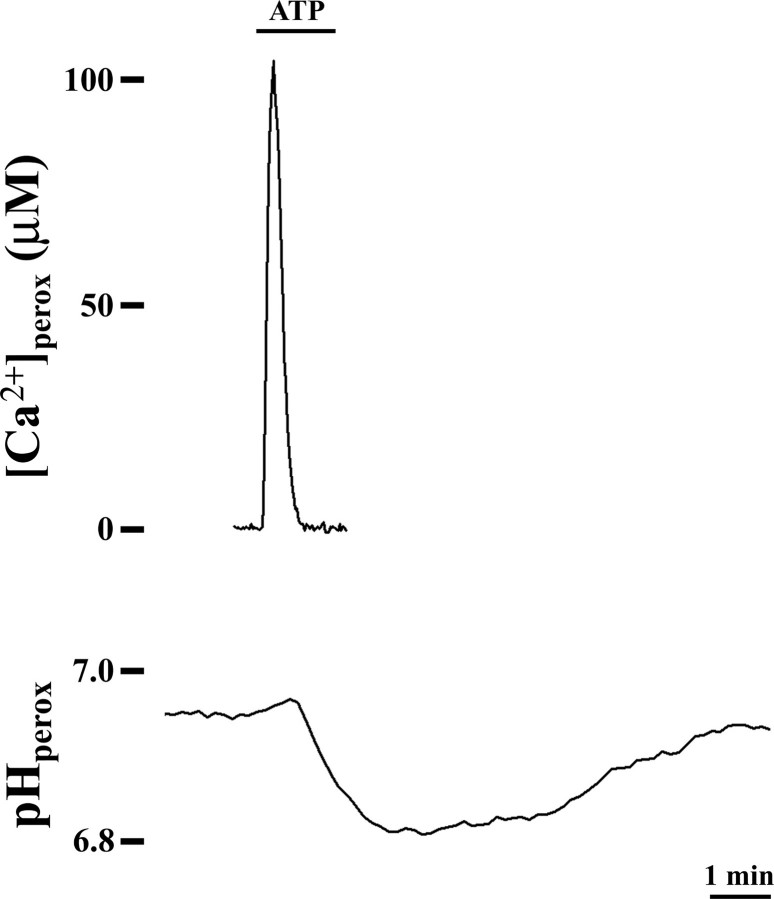
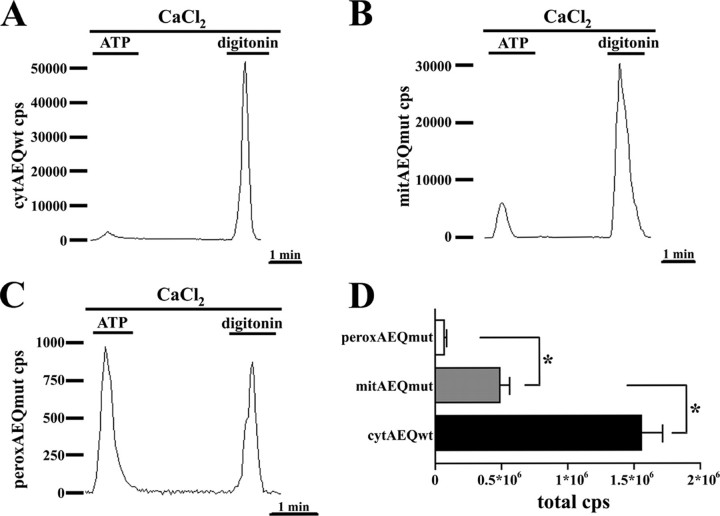
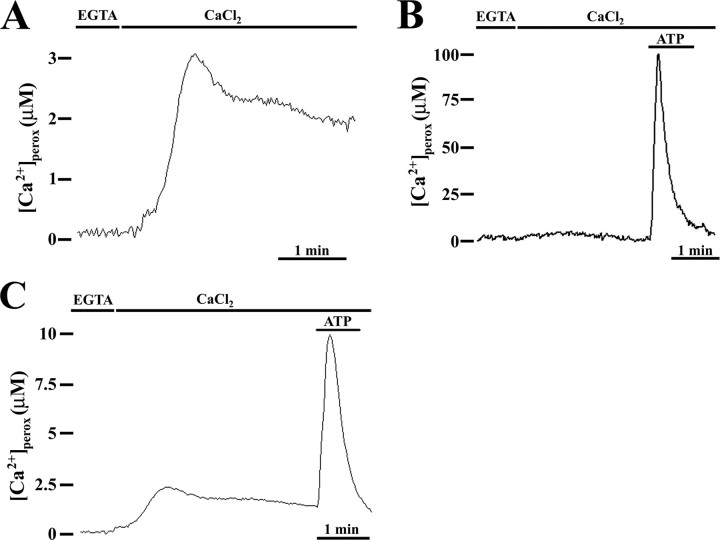
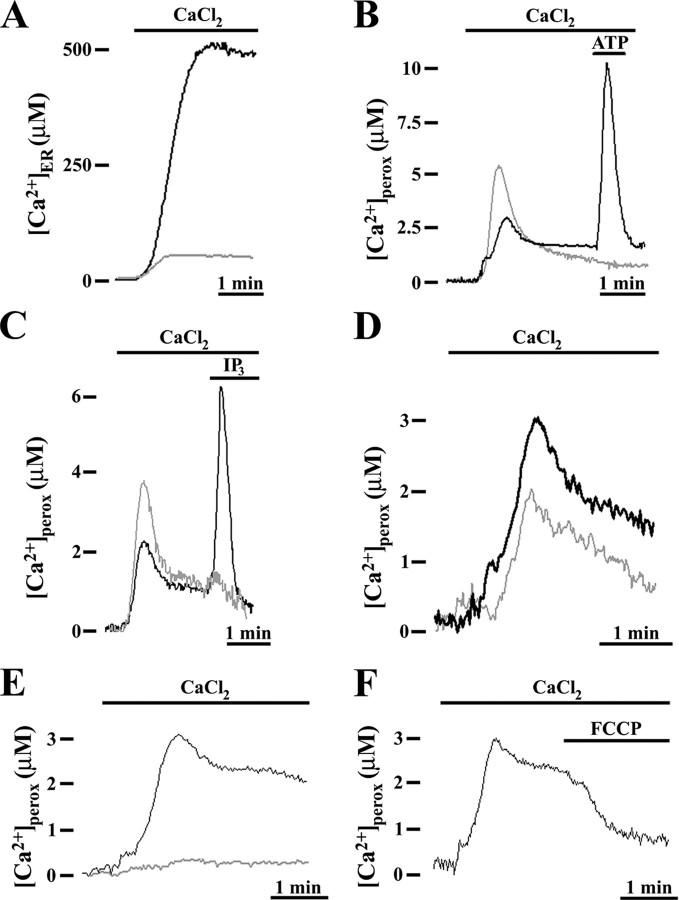
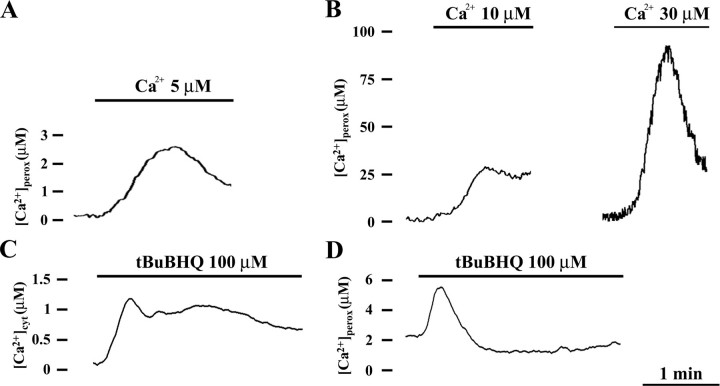
Ca2+ concentration in peroxisomal matrix ([Ca2+](perox)) has been monitored dynamically in mammalian cells expressing variants of Ca2+-sensitive aequorin specifically targeted to peroxisomes. Upon stimulation with agonists that induce Ca2+ release from intracellular stores, peroxisomes transiently take up Ca2+ reaching peak values in the lumen as high as 50-100 microm, depending on cell types. Also in resting cells, peroxisomes sustain a Ca2+ gradient, [Ca2+](perox) being approximately 20-fold higher than [Ca2+] in the cytosol ([Ca2+](cyt)). The properties of Ca2+ traffic across the peroxisomal membrane are different from those reported for other subcellular organelles. The sensitivity of peroxisomal Ca2+ uptake to agents dissipating H+ and Na+ gradients unravels the existence of a complex bioenergetic framework including V-ATPase, Ca2+/H+, and Ca2+/Na+ activities whose components are yet to be identified at a molecular level. The different [Ca2+](perox) of resting and stimulated cells suggest that Ca2+ could play an important role in the regulation of peroxisomal metabolism.


Figures

FIGURE 1.
FIGURE 1.
Schematic map of peroxAEQwt and peroxAEQmut and subcellular localization of peroxAEQwt. A, the two peroxisomal aequorin chimeras were generated by adding the PTS1 sequence downstream from the cDNAs encoding the HA1-tagged wild-type and mutant aequorins. For the peroxAEQmut, an asterisk indicates the position of the D119A mutation of the aequorin cDNA. B, CHO cells were transiently co-transfected with pcDNA3-peroxAEQwt and peroxi-DsRed2 plasmid. Thirty-six hours after transfection, the cells were fixed and permeabilized for immunostaining. The images were acquired by fluorescence microscopy. Identical fields are presented. Panel i, green immunofluorescence of CHO cells labeled with HA.11 antibody and anti-mouse AlexaFluor 488 conjugated as secondary fluorescent antibody. Panel ii, red fluorescence of peroxisome-targeted DsRed2. Details of peroxisomal co-localization are magnified in the insets at the right corners of both panels. Bars, 10 μm.
FIGURE 2.
FIGURE 2.
Ca2+ uptake occurs in peroxisomes of agonist-stimulated CHO cells to a higher extent than in mitochondria and cytosol and is not inhibited by ruthenium red. AC, cells were seeded onto glass coverslips and transfected in parallel batches with pcDNA3-peroxAEQmut, VR1012-mitAEQmut (18), and VR1012-cytAEQwt (15). After 36 h, recombinant aequorins were reconstituted with 5 μm coelenterazine in 5% CO2 atmosphere at 37°C for 2 h in KRB/Ca2+ medium supplemented with 5.5 mm glucose. At the luminometer, the cells were perfused with the same medium and triggered with 100 μm ATP. The experiments were terminated lysing the cells with a Ca2+-rich hypotonic medium, and collection and calibration of the output luminescence were carried out, as described under “Experimental Procedures.” The data are representative of 15 experiments that yielded similar results. D, CHO cells were transfected in parallel with VR1012/mitAEQmut or pcDNA3/peroxAEQmut. After reconstitution of the recombinant probes with 5 μm coelenterazine, the cells were permeabilized by 1-min incubation with 20 μm digitonin (19) and perfused in IB buffer. Mitochondrial (mit) and peroxisomal (perox) Ca2+ uptakes were measured upon the addition of 5 μm IP3 in the presence or absence of 4 μm ruthenium red. Aequorin luminescence was calibrated and measured into [Ca2+] values, and the presented data ± S.E. (error bars) from four replicates express the inhibition percentages of Ca2+ uptake as compared with control cells (*, p < 0.001, one-way analysis of variance followed by Bonferroni's t test).
FIGURE 3.
FIGURE 3.
Peroxisomal and mitochondrial agonist-evoked Ca2+ uptake have different sensitivities to H+ gradient collapsing reagents and to benzothiazepine CGP37157. A, CHO cells expressing peroxAEQmut were perfused in KRB/Ca2+ in the presence or absence of 40 μm chloroquine, 2 μm FCCP, 10 μm monensin, or 10 μm monensin plus 2 μm FCCP and stimulated with 100 μm ATP. In the case of bafilomycin, the cells were preincubated with 300 nm bafilomycin in KRB for 15 min at 37 °C before perfusion with KRB/Ca2+ and subsequent stimulation. B, CHO cells expressing mitAEQmut were perfused in KRB/Ca2+ in the presence or absence of 2 μm FCCP or 10 μm monensin and stimulated with 100 μm ATP. C, CHO cells expressing mitAEQmut or peroxAEQmut were perfused in KRB/Ca2+ and stimulated with 100 μm ATP in the absence or presence of 20 μm CGP37157. The data are representative of at least 15 separate experiments that yielded similar results. Treatment with each of these reagents did not affect the integrity or the morphology of the organelles, as confirmed by fluorescence microscopy in cells expressing the peroxi-DsRed2 or the mitBFP (21) used as fluorescent markers for peroxisomes and mitochondria, respectively (not shown).
FIGURE 4.
FIGURE 4.
The peroxisomal pH changes when cells are stimulated by Ca2+-mobilizing extracellular agonists. CHO cells expressing peroxAEQmut (upper trace) or peroxi-pHluorin (lower trace) were perfused at 37 °C in KRB/Ca2+ medium plus 5.5 mm glucose and challenged, where indicated, with 100 μm ATP. pHluorin ratiometric fluorescence values obtained at 405/485-nm excitation were imaged as described under “Experimental Procedures”; the corresponding pH values were calculated by perfusing the cells at the end of the experiment with pH-buffered solutions supplemented with 1 μm FCCP plus 10 μm monensin. The data are representative of at least 10 separate parallel experiments that yielded similar results.
FIGURE 5.
FIGURE 5.
Cells expressing peroxAEQmut output very low luminescence signals compared with cells expressing cytAEQwt or mitAEQmut. CHO cells expressing cytAEQwt (A), mitAEQmut (B), or peroxAEQmut (C) were reconstituted with 5 μm coelenterazine in KRB/Ca2+ medium supplemented with 5.5 mm glucose. At the luminometer, the cells were perfused with the same buffer, challenged with 100 μm ATP, and lysed in the presence of 0.1 mm digitonin and 10 mm CaCl2. The traces are representative of 15 experiments showing similar results. D, total luminescence counts from cells expressing cytAEQwt, mitAEQmut, or peroxAEQmut were collected from 15 parallel experiments having similar background count rate and duration. The significance of the differences among the luminescences of the three aequorin probes is indicated (*, p < 0.001, one-way analysis of variance followed by Bonferroni's t test).
FIGURE 6.
FIGURE 6.
Peroxisomes accumulate Ca2+ during the resting state. CHO cells expressing peroxAEQwt (A and C) or peroxAEQmut (B) were depleted of Ca2+ by incubation with 5 μm ionomycin in KRB supplemented with 0.6 mm EGTA. Then aequorins were reconstituted in the same medium with 5 μm coelenterazine for 1–2 h at 4 °C. At the luminometer, after extensive washing with KRB in the presence of 2% bovine serum albumin and 1 mm EGTA, the cells were initially perfused with KRB supplemented with 0.1 mm EGTA and then with KRB/Ca2+. Where shown, after Ca2+ refilling, the cells were challenged with 100 μm ATP. The data are representative of at least 15 separate experiments, which yielded the same results. In these experiments, the EGTA plus ionomycin treatment, at 4 °C as well as at 37 °C, did not induce visible alterations in the shape or in the number of peroxisomes in comparison with nontreated cells, as demonstrated in fluorescence microscopy by imaging living CHO cells expressing peroxi-DsRed2 as a fluorescent peroxisomal marker (data not shown).
FIGURE 7.
FIGURE 7.
Resting peroxisomal Ca2+ accumulation is not affected by P-type ATPase inhibitors and is related to a H+ gradient across the peroxisomal membrane. CHO cells expressing endoplasmic reticulum aequorin (erAEQmut) (A) or peroxAEQwt (BF) were Ca2+-depleted as described in the legend to Fig. 6 and aequorins reconstituted with 5 μm coelenterazine (peroxAEQwt) or coelenterazine n (erAEQmut) for 1–2 h at 4 °C. A and B, in the luminometer chamber, the cells were perfused with KRB supplemented with 1 mm EGTA, and Ca2+ uptake into the cells was initiated by replacing EGTA with 1 mm CaCl2, as indicated. The cells were incubated with (gray traces) and without (black traces) 1 μm thapsigargin during the final 10 min of the reconstitution. C, cells were permeabilized with 20 μm digitonin, i.e. a concentration that preserves the integrity of the peroxisomes and of the other subcellular organelles (19) and perfused in IB/EGTA medium. Ca2+ uptake was triggered by omitting EGTA (with ∼5 μm Ca2+) in the presence (gray trace) or absence (black trace) of 100 μm orthovanadate. Where indicated 100 μm ATP (B) or 5 μm IP3 (C) were added to challenge the IP3-mediated peroxisomal Ca2+ uptake. D, cells were incubated with (gray trace) or without (black trace) 300 nm bafilomycin in KRB supplemented with 1 mm EGTA for 15 min at 37 °C before replacing EGTA with 1 mm CaCl2. E and F, after Ca2+ depletion and aequorin reconstitution, CHO cells were initially perfused with KRB supplemented with 1 mm EGTA and then with KRB/Ca2+ in the presence of 2 μm FCCP. All of the presented traces are representative of at least 15 separate experiments that yielded the same results.
FIGURE 8.
FIGURE 8.
Ca2+ sensitivity of CHO peroxisomes. Upper panel, CHO cells expressing peroxAEQwt (A) or peroxAEQmut (B) were permeabilized with digitonin as described in the legend to Fig. 7. Ca2+ uptake was triggered by perfusing the cells with IB in the presence of EGTA-buffered solutions of CaCl2 at the indicated concentrations. Lower panel, CHO cells expressing cytAEQwt (C) or peroxAEQwt (D) were Ca2+-depleted by treatment with oligomycin, and after Ca2+ refilling with KRB/Ca2+ were treated with 100 μm tBuBHQ diluted in the same medium. No [Ca2+]perox peaks were detected in CHO cells expressing peroxAEQmut in the same experimental conditions (not shown). All of the presented traces are representative of at least nine separate experiments that yielded similar results.

References

    1. Wanders, R. J., and Waterham, H. R. (2006) Annu. Rev. Biochem. 75 295-332 - PubMed
    1. Reddy, J. K., and Mannaerts, G. P. (1994) Annu. Rev. Nutr. 14 343-370 - PubMed
    1. Wanders, R. J. (2004) Am. J. Med. Genet. 126 355-375 - PubMed
    1. Palmieri, L., Rottensteiner, H., Girzalsky, W., Scarcia, P., Palmieri, F., and Erdmann, R. (2001) EMBO J. 20 5049-5059 - PMC - PubMed
    1. Lasorsa, F. M., Scarcia, P., Erdmann, R., Palmieri, F., Rottensteiner, H., and Palmieri, L. (2004) Biochem. J. 381 581-585 - PMC - PubMed

Publication types

LinkOut - more resources