. 2008 May 30;283(22):15209-16.
doi: 10.1074/jbc.M800348200. Epub 2008 Mar 24.

Structural and biophysical characterization of human myo-inositol oxygenase

Affiliations

Structural and biophysical characterization of human myo-inositol oxygenase

Ann-Gerd Thorsell et al. J Biol Chem. .

Abstract

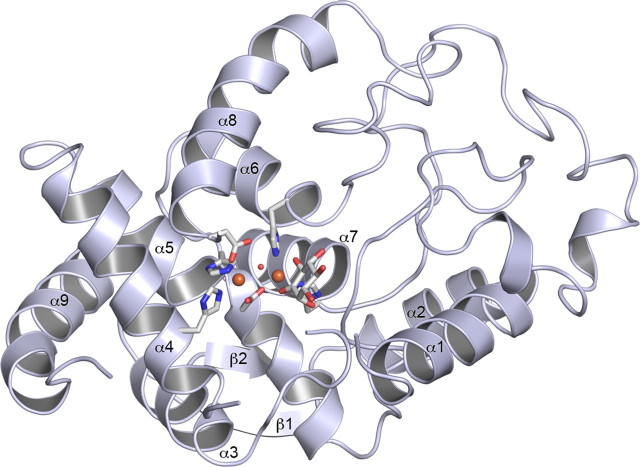
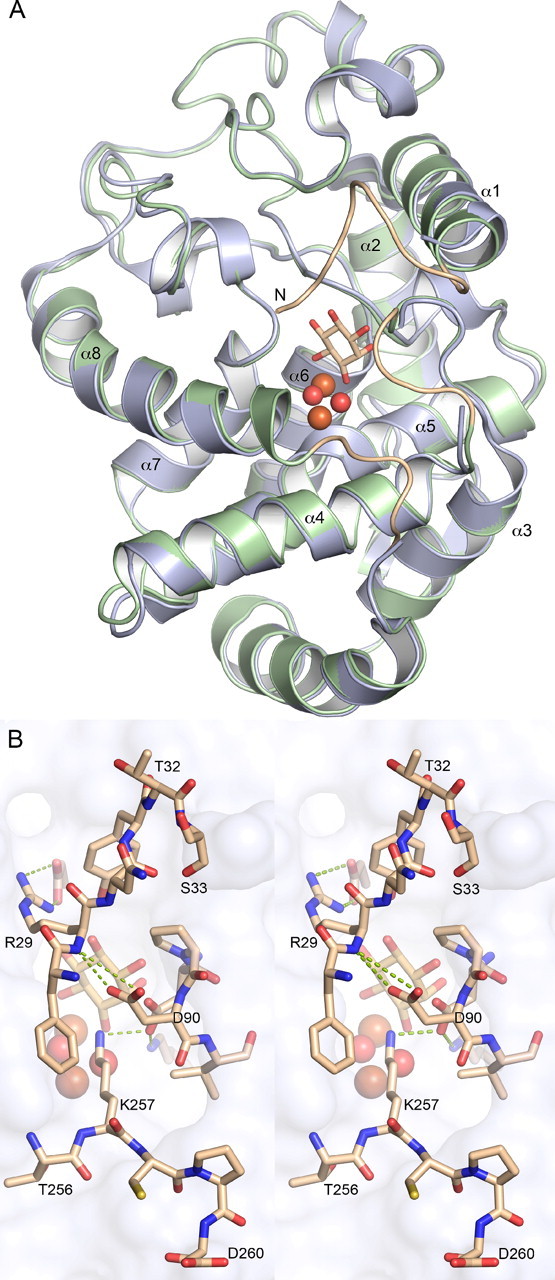
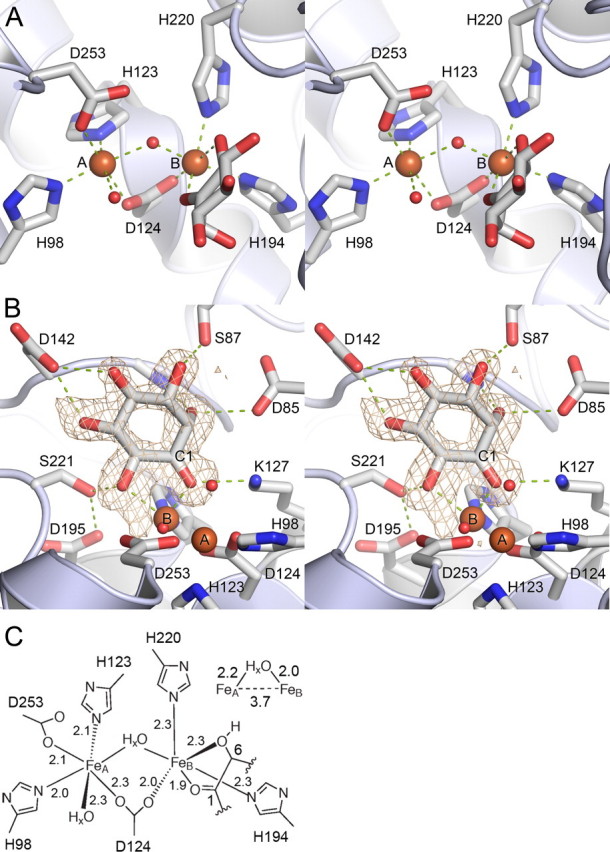
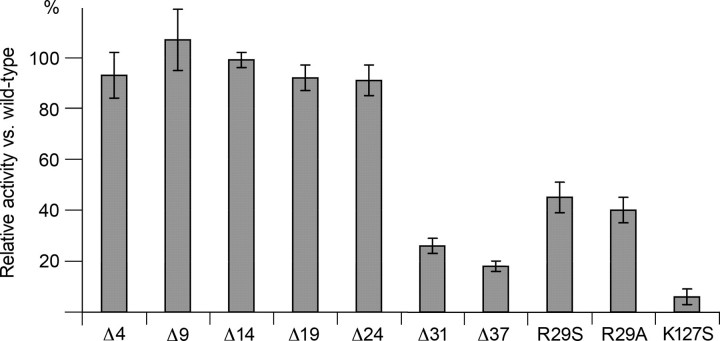
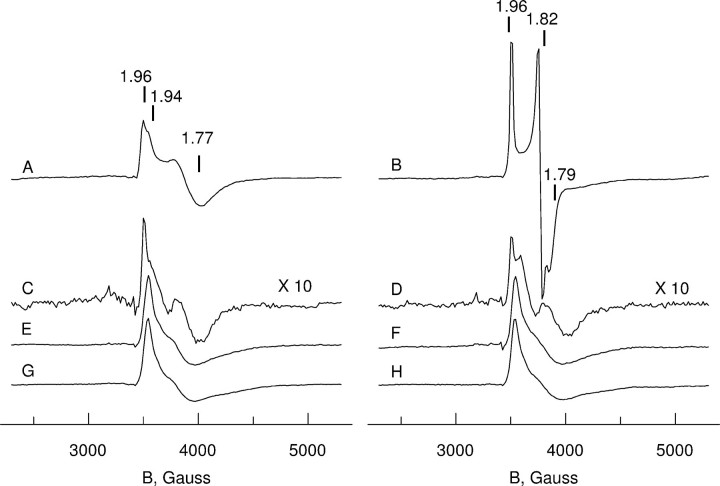
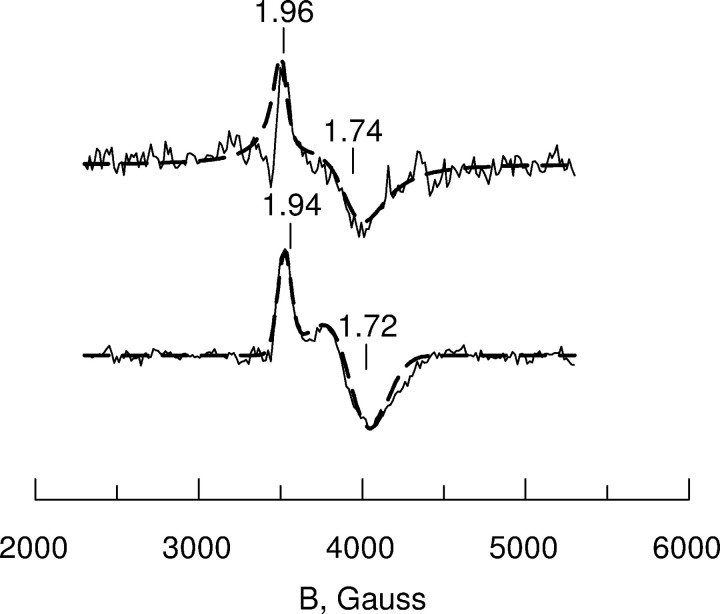
Altered inositol metabolism is implicated in a number of diabetic complications. The first committed step in mammalian inositol catabolism is performed by myo-inositol oxygenase (MIOX), which catalyzes a unique four-electron dioxygen-dependent ring cleavage of myo-inositol to D-glucuronate. Here, we present the crystal structure of human MIOX in complex with myo-inosose-1 bound in a terminal mode to the MIOX diiron cluster site. Furthermore, from biochemical and biophysical results from N-terminal deletion mutagenesis we show that the N terminus is important, through coordination of a set of loops covering the active site, in shielding the active site during catalysis. EPR spectroscopy of the unliganded enzyme displays a two-component spectrum that we can relate to an open and a closed active site conformation. Furthermore, based on site-directed mutagenesis in combination with biochemical and biophysical data, we propose a novel role for Lys(127) in governing access to the diiron cluster.


Figures

FIGURE 1.
FIGURE 1.
Structure of human myo-inositol oxygenase. A ribbon diagram with numbered secondary structure elements is shown. Direct ligands to the diiron-cluster are shown in stick representation. In all panels, iron atoms are shown as orange spheres, and the oxygens are shown as small red spheres.
FIGURE 2.
FIGURE 2.
Comparison between human and mouse MIOX. A, overview of a structural imposition of mouse MIOX (green) and human MIOX (light blue). The three loops present in the model of mouse MIOX but not in the human MIOX model are shown in light brown. B, interactions, shown as green dotted lines, between residues in the three loops covering the active site.
FIGURE 3.
FIGURE 3.
Close-up view on the active site. A, diiron cluster site (A and B, FeA and FeB, respectively). B, ligand-protein interactions. Omit Fo - Fc map calculated for myo-inosose-1 contoured at 3σ. C, diiron site coordination (distances in Å).
FIGURE 4.
FIGURE 4.
Relative enzymatic activity of mutations and N-terminal deletions compared with wild-type protein. Estimations of errors are denoted with error bars. ΔX denotes a construct entailing residues X + 1 to 285. Activity was measured using the standard orcinol-based assay (2).
FIGURE 5.
FIGURE 5.
EPR spectroscopy of wild type and mutants of human MIOX. A, EPR spectra of the mixed valent state of MIOX in the absence of substrate (left) and in the presence of the substrate myo-inositol (right). Spectra A and B, wild type protein; spectra C and D, Δ37; spectra E and F, K127S; spectra G and H, Δ37, K127S mutant protein. Shown is the sample preparation procedure according to “Experimental Procedures.” Spectra were taken at 7 K, at microwave power of 3 milliwatts (nonsaturating conditions for all paramagnetic mixed valent sites). The mixed valent state concentration was estimated by double integration of the spectra as 0.20(5) per polypeptide for spectra A and B and spectra E–H, whereas 0.02 perpolypeptide was found for spectra C and D. The g values indicated above spectra A and B give approximate descriptions of apparent spectral parameters (further discussed under “Experimental Procedures”).
FIGURE 6.
FIGURE 6.
EPR spectra and simulations of two components in the wild type human MIOX in the absence of substrate. The sample used in Fig. 5A was investigated under extreme conditions in order to emphasize the features of two distinct EPR spectral components. Upper trace, EPR at 20 K, 200 microwatts microwave power, showing dominating g = 1.96 component I, assigned to the open lid conformation. The low signal-to-noise ratio and the spectral imperfections are due to the very low microwave power applied in order to single out this component. The line shape is mainly Lorentzian due to the relatively high recording temperature. Lower trace, EPR at 5 K, 200 milliwatt microwave power showing dominating g = 1.94 component II, assigned to the closed lid conformation. The simulations (dashed lines superimposed on the experimental spectra) were made using the following parameters for g values and line widths. Upper trace, g = 1.96, g = 1.74, L = 60 G, L = 220 G and Lorentzian line shape; lower trace, g = 1.94, g = 1.72, L = 80 G, L = 250 G and Gaussian line shape.

References

    1. Winegrad, A. I. (1987) Diabetes 36 396-406 - PubMed
    1. Arner, R. J., Prabhu, K. S., Thompson, J. T., Hildenbrandt, G. R., Liken, A. D., and Reddy, C. C. (2001) Biochem. J. 360 313-320 - PMC - PubMed
    1. Naber, N. I., Swan, J. S., and Hamilton, G. A. (1986) Biochemistry 25 7201-7207 - PubMed
    1. Arner, R. J., Prabhu, K. S., and Reddy, C. C. (2004) Biochem. Biophys. Res. Commun. 324 1386-1392 - PubMed
    1. Arner, R. J., Prabhu, K. S., Krishnan, V., Johnson, M. C., and Reddy, C. C. (2006) Biochem. Biophys. Res. Commun. 339 816-820 - PubMed

Publication types