. 2008 Mar;20(3):509-23.
doi: 10.1105/tpc.107.056523. Epub 2008 Mar 25.

Mode of inheritance of primary metabolic traits in tomato

Affiliations

Mode of inheritance of primary metabolic traits in tomato

Nicolas Schauer et al. Plant Cell. 2008 Mar.

Abstract

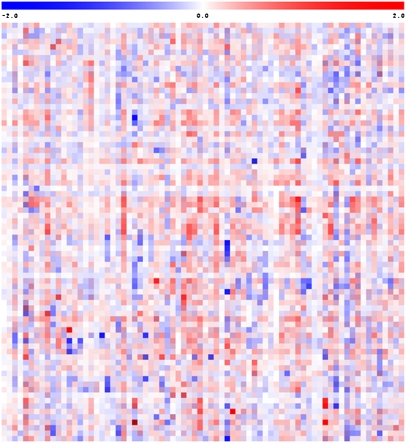
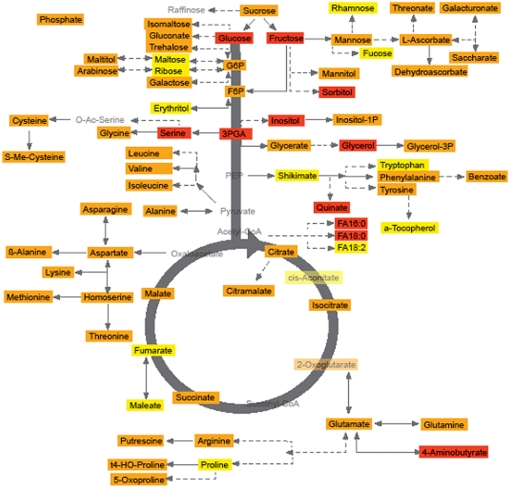
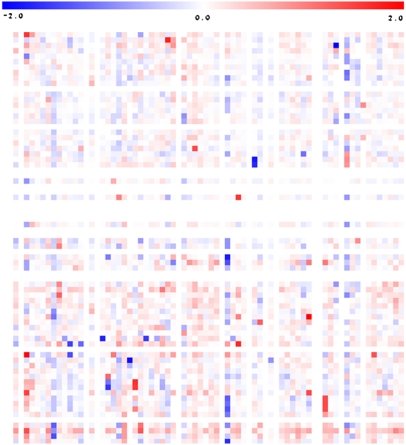
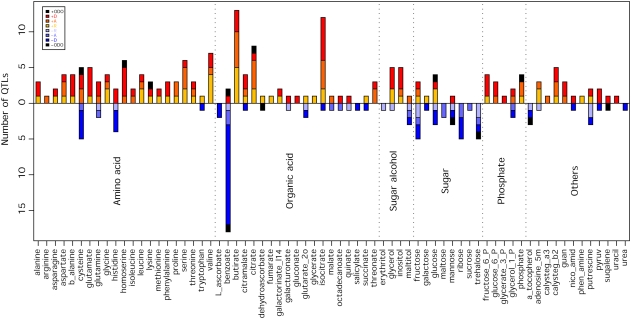
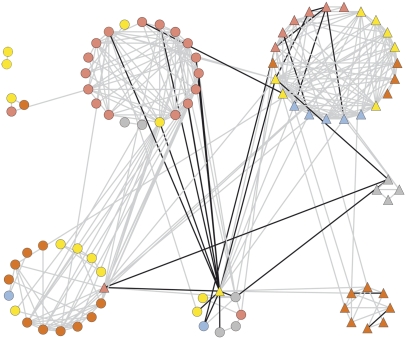
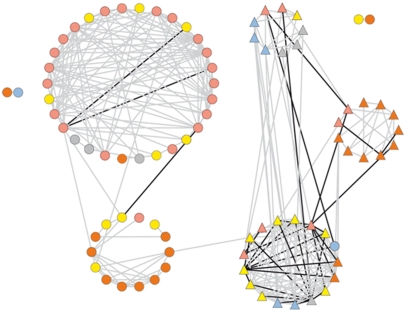
To evaluate components of fruit metabolic composition, we have previously metabolically phenotyped tomato (Solanum lycopersicum) introgression lines containing segmental substitutions of wild species chromosome in the genetic background of a cultivated variety. Here, we studied the hereditability of the fruit metabolome by analyzing an additional year's harvest and evaluating the metabolite profiles of lines heterozygous for the introgression (ILHs), allowing the evaluation of putative quantitative trait locus (QTL) mode of inheritance. These studies revealed that most of the metabolic QTL (174 of 332) were dominantly inherited, with relatively high proportions of additively (61 of 332) or recessively (80 of 332) inherited QTL and a negligible number displaying the characteristics of overdominant inheritance. Comparison of the mode of inheritance of QTL revealed that several metabolite pairs displayed a similar mode of inheritance of QTL at the same chromosomal loci. Evaluation of the association between morphological and metabolic traits in the ILHs revealed that this correlation was far less prominent, due to a reduced variance in the harvest index within this population. These data are discussed in the context of genomics-assisted breeding for crop improvement, with particular focus on the exploitation of wide biodiversity.


Figures

Figure 1.
Figure 1.
Overlay Heat Map of the Metabolite Profiles of Three Independent Studies of the Pericarp Metabolite Content of the ILs Compared with the Parental Control (M82). Data come from a novel field trial performed in 2004 and are presented alongside those of 2003 and 2001 (published in Schauer et al., 2006). Large sections of the map are white or pale in color, reflecting that many of the chromosomal segment substitutions do not have an effect on the amount of every metabolite. Regions of red or blue indicate that the metabolite content is increased or decreased, respectively, after introgression of S. pennellii segments. Very dark coloring indicates that a large change in metabolite content was conserved across all three harvests, whereas purple indicates an inconsistent change in that IL relative to M82. For each harvest, GC-MS was used to quantify 74 metabolites, including amino acids, organic acids, fatty acids, sugars, sugar alcohols, and vitamins. Due to space constraints, this heat map is not annotated; however, fully annotated heat maps for the individual data sets are provided in Supplemental Figures 1 to 4 online.
Figure 2.
Figure 2.
Metabolites That Display High, Moderate, and Low Hereditability as Assessed from the 3 Years of Growth Trials. Data given in Table 1 are displayed in a pathway-based manner. Metabolites marked in red were determined to be highly hereditable, those in yellow to display low hereditability, and those in orange to be intermediate. Traits colored pale gray were not measured in this study.
Figure 3.
Figure 3.
Heat Map of the Metabolite Profiles of M82 Lines Heterozygous (ILH) for Chromosomal Segmental Substitution from S. pennellii. Results presented are pericarp metabolite content data obtained from the ILHs of the 2004 harvest. Regions of dark red or dark blue indicate that the metabolite content is increased or decreased, respectively, after introgression of S. pennellii segments. GC-MS was used to quantify 74 metabolites, including amino acids, organic acids, fatty acids, sugars, sugar alcohols, and vitamins. Due to space constraints, this heat map is not annotated; however, a fully annotated heat map including the metabolite profiles of the ILHs from the 2004 harvest is provided in Supplemental Figure 6 online.
Figure 4.
Figure 4.
Distribution of the QTL Mode of Inheritance for Metabolite Accumulation. Each vertical bar represents the number of QTL for a specific trait, colored according to mode-of-inheritance categories: A, additive; D, dominant; ODO, overdominant; R, recessive. The bars above the 0 line represent the number of increasing QTL, whereas the negative bars represent the number of decreasing QTL relative to M82.
Figure 5.
Figure 5.
Cartographic Representation of the Combined Metabolic and Morphological Networks of the ILs. Each morphological trait (node) is represented by a triangle and color as follows: red, fruit-associated; orange, flower-associated; yellow, yield-associated; gray, seed morphology; light blue, seed yield. Each metabolic trait (node) is represented by a circle and color as follows: red, amino acids; orange, sugars and sugar alcohols; yellow, organic acids; gray, phosphorylated intermediates; light blue, miscellaneous metabolites. Interactions are indicated with lines: gray represents positive correlations and black represents negative correlations. A fully annotated version of this figure is available as Supplemental Figure 8 online.
Figure 6.
Figure 6.
Cartographic Representation of the Combined Metabolic and Morphological Networks of the ILHs. Each morphological trait (node) is represented by a triangle and color as follows: red, fruit-associated; orange, flower-associated; yellow, yield-associated; gray, seed morphology; light blue, seed yield. Each metabolic trait (node) is represented by a circle and color as follows: red, amino acids; orange, sugars and sugar alcohols; yellow, organic acids; gray, phosphorylated intermediates; light blue, miscellaneous metabolites. Interactions are indicated with lines: gray represents positive correlations and black represents negative correlations. A fully annotated version of this figure is available as Supplemental Figure 9 online.

References

    1. Alonso, J.M., Stepanova, A.N., Solano, R., Wisman, E., Ferrari, S., Ausubel, F.M., and Ecker, J.R. (2003). Five components of the ethylene-response pathway identified in a screen for weak ethylene-insensitive mutants in Arabidopsis. Proc. Natl. Acad. Sci. USA 100 2992–2997. - PMC - PubMed
    1. Ashikari, M., Sakakibara, H., Lin, S.Y., Yamamoto, T., Takashi, T., Nishimura, A., Angeles, E.R., Qian, Q., Kitano, H., and Matsuoka, M. (2005). Cytokinin oxidase regulates rice grain production. Science 309 741–745. - PubMed
    1. Bartels, D., and Sunkar, R. (2005). Drought and salt tolerance in plants. Review. Crit. Rev. Plant Sci. 24 23–58.
    1. Baxter, C.J., Sabar, M., Quick, W.P., and Sweetlove, L.J. (2005). Comparison of changes in fruit gene expression in tomato introgression lines provides evidence of genome-wide transcriptional changes and reveals links to mapped QTLs and described traits. J. Exp. Bot. 56 1591–1604. - PubMed
    1. Bentsink, L., Alonso-Blanco, C., Vreugdenhil, D., Tesnier, K., Groot, S.P., and Koornneef, M. (2000). Genetic analysis of seed-soluble oligosaccharides in relation to seed storability of Arabidopsis. Plant Physiol. 124 1595–1604. - PMC - PubMed

Publication types

MeSH terms

LinkOut - more resources