. 2008 Mar;20(3):803-16.
doi: 10.1105/tpc.107.056390. Epub 2008 Mar 25.

Phospholipase Dalpha3 is involved in the hyperosmotic response in Arabidopsis

Affiliations

Phospholipase Dalpha3 is involved in the hyperosmotic response in Arabidopsis

Yueyun Hong et al. Plant Cell. 2008 Mar.

Abstract

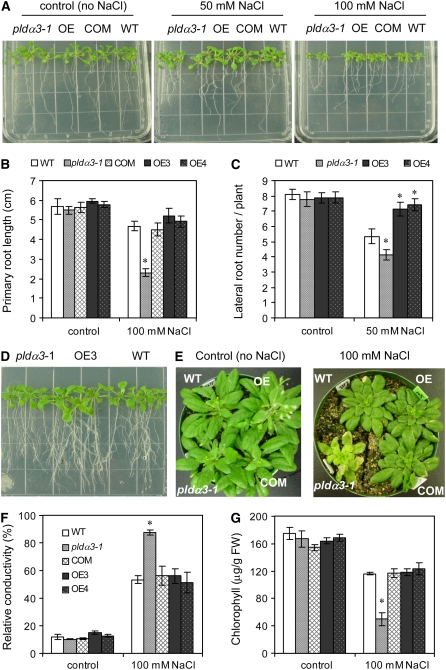
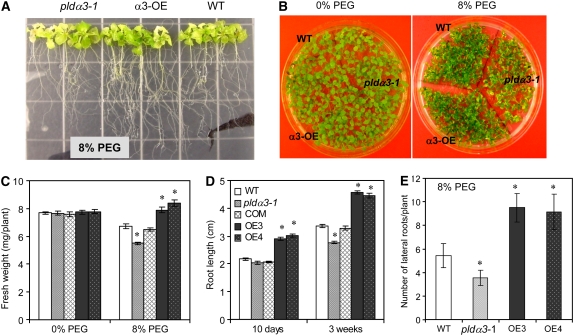
Rapid activation of phospholipase D (PLD), which hydrolyzes membrane lipids to generate phosphatidic acid (PA), occurs under various hyperosmotic conditions, including salinity and water deficiency. The Arabidopsis thaliana PLD family has 12 members, and the function of PLD activation in hyperosmotic stress responses has remained elusive. Here, we show that knockout (KO) and overexpression (OE) of previously uncharacterized PLDalpha3 alter plant response to salinity and water deficit. PLDalpha3 uses multiple phospholipids as substrates with distinguishable preferences, and alterations of PLDalpha3 result in changes in PA level and membrane lipid composition. PLDalpha3-KO plants display increased sensitivities to salinity and water deficiency and also tend to induce abscisic acid-responsive genes more readily than wild-type plants, whereas PLDalpha3-OE plants have decreased sensitivities. In addition, PLDalpha3-KO plants flower later than wild-type plants in slightly dry conditions, whereas PLDalpha3-OE plants flower earlier. These data suggest that PLDalpha3 positively mediates plant responses to hyperosmotic stresses and that increased PLDalpha3 expression and associated lipid changes promote root growth, flowering, and stress avoidance.


Figures

Figure 1.
Figure 1.
PLDα3 Expression, Reaction Conditions, and Substrate Specificity. (A) Expression of PLDα3 and -α1 in Arabidopsis tissues, as quantified by real-time PCR normalized to Ubiquitin10 (UBQ10). Values are means ± sd (n = 3 separate samples). (B) Production of HA-tagged PLDα3 in Arabidopsis wild-type plants. Leaf proteins extracted from PLDα3-HA transgenic plants were separated by 8% SDS-PAGE and transferred to a polyvinylidene difluoride membrane. PLDα3-HA was visualized by alkaline phosphatase conjugated to secondary anti-mouse antibody after blotting with HA antibody. Lanes 1 through 5 represent different transgenic lines carrying the PLDα3-HA overexpression construct. (C) PLDα3 activity under PLDα1, -β, -δ, and -ζ1 assay conditions. PLDα3-HA protein was expressed and purified from Arabidopsis leaves using HA antibody affinity immunoprecipitation and was subjected to PLDα3 activity assays under PLDα1, -β, -δ, and -ζ1 reaction conditions using dipalmitoylglycero-3-phospho-(methyl-3H) choline as a substrate. Values are means ± sd (n = 3) of three independent experiments. (D) Quantification of the hydrolytic activity of PLDα3 toward 12-(7-nitro-2-1,3-benzoxadiazol-4-yl)amino PC, PE, PG, and PS. The lipid spots on thin layer chromatography plates corresponding to substrates (PC, PE, PG, and PS) and product (PA) were scraped, and the lipids were extracted for fluorescence measurement (excitation at 460 nm, emission at 534 nm). Vector is a negative control that refers to reactions using HA antibody immunoprecipitates from proteins of empty vector–transformed Arabidopsis plants. Values are means ± sd (n = 3) of three experiments.
Figure 2.
Figure 2.
The T-DNA Insertion Mutant of PLDα3 and Effects of PLDα3 Alterations on Seed Germination under Salt Stress. (A) T-DNA insertion in the second exon of PLDα3. White boxes indicate exons of PLDα3. (B) Confirmation of the T-DNA insertion in pldα3-1. PCR of genomic DNA from wild-type and pldα3-1 plants using two pairs of primers: T-DNA refers to the fragment amplified using the left border primer and a PLDα3-specific primer; PLDα3 marks the fragment amplified using two PLDα3 primers, one on either side of the T-DNA insert. The presence of the T-DNA band and the lack of the PLDα3 band in pldα3-1 indicates that it is a homozygous T-DNA insertion mutant. The experiment was repeated three times under the same conditions. (C) The loss of PLDα3 transcript in pldα3-1. RT-PCR of RNA from wild-type and pldα3-1 plants using two pairs of primers: PLDα3-specific primers detect the expression of the PLDα3 mRNA, and UBQ10 primers were used as a control to indicate the same amount of mRNA between pldα3-1 and wild-type plants. The experiment was repeated three times under the same conditions. (D) to (G) Seeds were germinated in Murashige and Skoog (MS) medium containing 0 (control), 150, or 200 mM NaCl. COM, PLDα3 complementation; OE, PLDα3 overexpression; pldα3-1, PLDα3 knockout mutant. Values are means ± sd (n = 3) from one representative of three independent experiments with similar results. One hundred seeds per genotype were measured in each experiment. The photographs were taken at 3 d after seeds were sown. Bar = 3 mm.
Figure 3.
Figure 3.
Effects of Altering PLDα3 Expression on Salt Tolerance. (A) to (C) Changes in seedling growth under salt stress as affected by PLDα3 KO and OE. Four-day-old seedlings were transferred to MS agar plates with 0 (control), 50, or 100 mM NaCl. Primary root length was measured at 2 weeks after transfer. Lateral roots were counted at 6 d after transfer. Values are means ± sd (n = 15) from one representative of three independent experiments. The height of each square on the plate is 1.4 cm. * Significant at P < 0.05 compared with the wild type based on Student's t test. (D) Seedling growth in 50 mM NaCl on agar plates for 3 weeks. (E) Changes in salt tolerance in soil-grown, PLDα3-altered plants. Three-week-old plants were irrigated with water only (control) or 100 mM NaCl solution. Photographs were taken at 3 weeks after treatment. (F) Membrane ion leakage of PLDα3-altered and wild-type plants in response to salt stress. The relative conductivity (an indicator of ion leakage) of leaves was measured in plants grown in soil treated with water only (control) or 100 mM NaCl solution for 2 weeks. Values are means ± sd (n = 3) from one of three independent experiments. * Significant at P < 0.05 compared with the wild type based on Student's t test. (G) Chlorophyll content of PLDα3-altered and wild-type plants in response to salt stress. The chlorophyll content of leaves was measured in plants as described for (E). Values are means ± sd (n = 3) from one of three independent experiments with similar results. * Significant at P < 0.05 compared with the wild type based on Student's t test.
Figure 4.
Figure 4.
Growth of Wild-Type, PLDα3-KO, and PLDα3-OE Plants under Hyperosmotic Stress. (A) and (B) Root and seedling phenotypes. (C) Seedling fresh weight. Seeds were germinated and grown on MS (control) or MS agar plates containing 8% PEG. Fresh weights were measured at 15 d after seeds were sown. Values are means ± sd (n = 10) from one of three independent experiments. At least 30 seedlings of each genotype were measured. (D) Primary root length. Five-day-old seedlings were transferred to 8% PEG in MS agar plates for 3 weeks, and primary root length was measured. Values are means ± sd (n = 10) from one of three independent experiments. At least 30 seedlings of each genotype were measured. (E) Lateral root number. Root number was counted at 2 weeks after 5-d-old seedlings were transferred to 8% PEG on MS agar plates. Values are means ± sd (n = 10) from one of three independent experiments. * Significant at P < 0.05 compared with the wild type based on Student's t test.
Figure 5.
Figure 5.
Flowering Time Changes in PLDα3-KO and PLDα3-OE Plants under Water Deficit. (A) Flowering times of PLDα3-altered and wild-type plants grown under the same water-deficient conditions. (B) Immunoblot of PLDα3 levels in two PLDα3-OE lines (top panel) and the association of the PLDα3 protein level with flowering time (bottom panel) under water deficit conditions. (C) and (D) Days to bolting and number of rosette leaves in bolting plants under water deficit. Values are means ± sd (n = 15) from one representative of three independent experiments. (E) Number of siliques in two PLDα3-OE lines, wild-type plants, and plants transformed with the empty vector. Silique numbers were counted in 55-d-old plants grown under water deficit conditions. KO plants were not scored because they flowered later. Values are means ± sd (n = 20). (F) to (H) Expression of FT, BFT, and TSF in wild-type, PLDα3-KO, and PLDα3-OE plants. mRNA was extracted from leaves of 3-week-old plants (before inflorescence formation under well-watered conditions; control) or from leaves of plants during inflorescence or flowering under water deficit (25 to 30% of soil water capacity). The expression levels were monitored by quantitative real-time PCR normalized by comparison with UBQ10. Values are means ± sd (n = 3). * Significant at P < 0.05 compared with the wild type based on Student's t test.
Figure 6.
Figure 6.
ABA Content in and Effect on PLDα3-Altered and Wild-Type Plants. (A) ABA content and the expression of ABA-responsive genes in PLDα3-altered and wild-type plants under water deficit. ABA content was measured by mass spectrometry, and ABA-responsive genes were examined by real-time PCR in 3-week-old plants during the transition from control water (90% of soil water capacity) to water-deficient (25 to 30% of soil water capacity) conditions. The number of days refers to days without watering under the water deficit conditions. Values are means ± sd (n = 3 independent samples) from one of two independent experiments with similar results. * Significant at P < 0.05 compared with the wild type based on Student's t test; a,b significant at P < 0.05 compared with day 0 within the same genotype. (B) and (C) Effect of ABA on the growth of PLDα3-altered seedlings. Seeds were germinated in MS medium containing 5 μM ABA. Fresh weights were measured at 5 weeks after germination. Values are means ± sd (n = 20) from one of three experiments. (D) Water loss from detached leaves of PLDα3-altered plants. The leaves were detached from 5-week-old plants and exposed to cool-white light (100 μmol·m−2·s−1) at 23°C. Loss of fresh weight was used as a measure of water loss. pldα1 represents the PLDα1 knockout mutant. Values are means ± sd (n = 5).
Figure 7.
Figure 7.
Lipid Changes in Plants in Response to Drought Stress. (A) Total lipid levels in PLDα3-altered, PLDα1-KO, and wild-type plants under water deficit and well-watered conditions. Four-week-old plants grown in growth chambers were not watered until the relative water content of leaves was ∼40%. Well-watered plants were used as controls. Leaf lipids were extracted from four different samples and profiled by ESI–tandem mass spectrometry. Values are means ± se (n = 4) (B) Lipid species in PLDα3-altered and wild-type plants under water deficit. Values are means ± se (n = 4) of four different samples. * Significant at P < 0.05 compared with the wild type based on Student's t test.
Figure 8.
Figure 8.
Levels of TOR Expression, AGC2.1 Expression, and Phosphorylated S6K Protein in PLDα3-Altered and Wild-Type Seedlings under Hyperosmotic Stress. (A) Expression levels of TOR and AGC2.1 under salt and water deficit conditions. Four-day-old seedlings were transferred to MS agar plates containing 100 mM NaCl or 8% PEG. Seedlings grown in MS without NaCl or PEG were used as the control. RNA was extracted from seedlings at 3 weeks after transfer. Gene expression level was quantified by real-time PCR normalized by UBQ10. Values are means ± sd (n = 3) from one of two experiments with similar results. * Significant at P < 0.05 compared with the wild type based on Student's t test. (B) Level of phosphorylated S6K. Proteins were extracted from seedlings grown in the same conditions described for (A). The same amounts of proteins (12 μg/lane) were separated by 10% SDS-PAGE and then transferred to nitrocellulose membranes. Phosphorylated S6K was detected by immunoblotting with anti-phospho-p70 S6K (Thr-389) antibody. The data shown are based on one of two experiments with similar results.

References

    1. Anthony, R.G., Henrigues, R., Helfer, A., Meszaros, T., Rios, G., Testerink, G., Munnik, T., Deak, M., Koncz, C., and Bogre, L. (2004). A protein kinase target of a PDK1 signalling pathway is involved in root hair growth in Arabidopsis. EMBO J. 23 572–581. - PMC - PubMed
    1. Bezerra, I.C., Michaels, S.D., Schomburg, F.M., and Amasino, R.M. (2004). Lesions in the mRNA cap-binding gene ABA HYPERSENSITIVE 1 suppress FRIGIDA-mediated delayed flowering in Arabidopsis. Plant J. 40 112–119. - PubMed
    1. Bray, E.A. (2004). Genes commonly regulated by water-deficit stress in Arabidopsis thaliana. J. Exp. Bot. 55 2331–2341. - PubMed
    1. Chinnusamy, V., Schumaker, K., and Zhu, J.K. (2004). Molecular genetic perspectives on cross-talk and specificity in abiotic stress signalling in plants. J. Exp. Bot. 55 225–236. - PubMed
    1. Corbesier, L., Vincent, C., Jang, S., Fornara, F., Fan, Q., Searle, I., Giakountis, A., Farrona, S., Gissot, L., Turnbull, C., and Coupland, G. (2007). FT protein movement contributes to long-distance signaling in floral induction of Arabidopsis. Science 316 1030–1033. - PubMed

MeSH terms