

Comparison of four depth-encoding PET detector modules with wavelength shifting (WLS) and optical fiber read-out
- PMID: 18364541
- PMCID: PMC2649025
- DOI: 10.1088/0031-9155/53/7/002
Comparison of four depth-encoding PET detector modules with wavelength shifting (WLS) and optical fiber read-out
Abstract
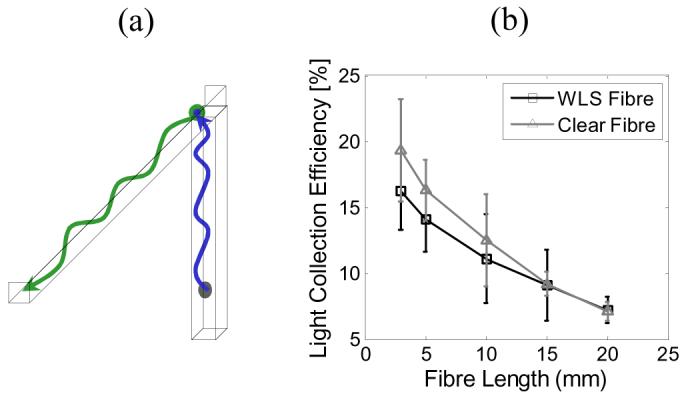
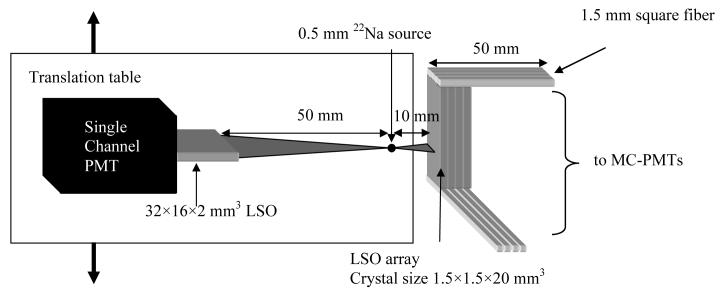
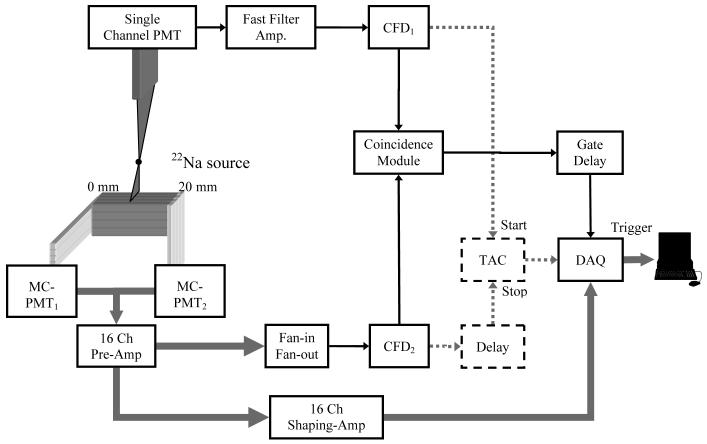
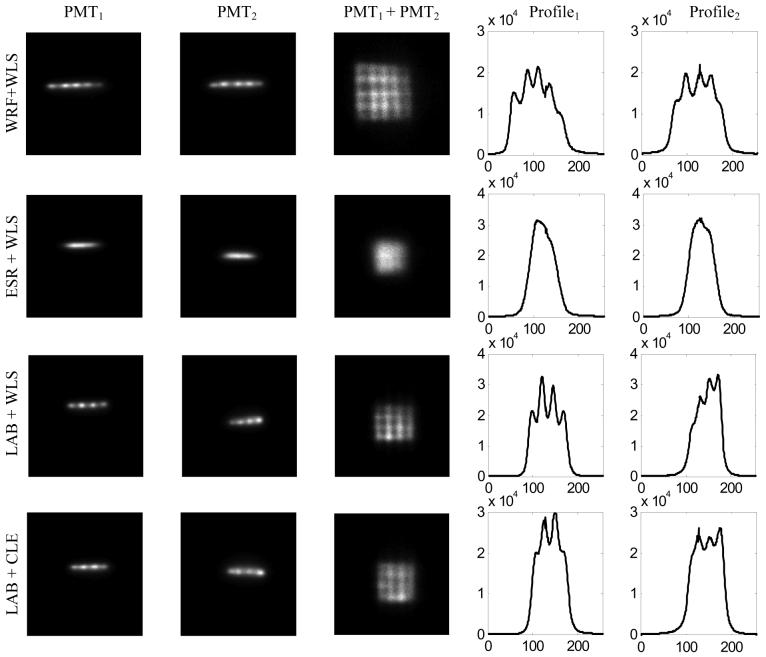
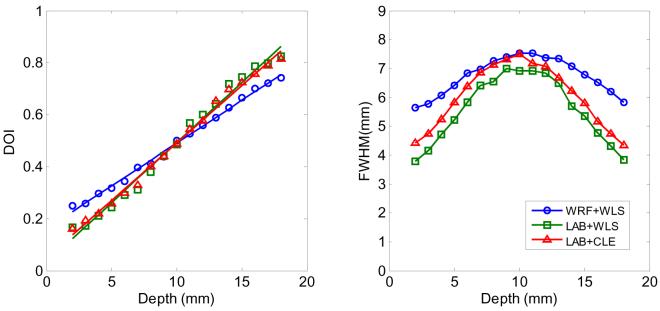
We propose detectors for a laboratory positron emission tomography scanner specific for mouse imaging that utilizes fewer detectors and channels of electronics compared with existing designs. The detectors are based on lutetium oxyorthosilicate arrays, read out by orthogonal optical fibers placed on the top and bottom of the arrays. Depth of interaction (DOI) information is obtained from the ratio of the signals at either end of the array. Four different detector modules were evaluated, using different reflector materials and two types of optical fibers (wavelength shifting (WLS) fibers and clear optical fibers). The modules were compared in terms of flood histograms, energy resolution, DOI resolution and timing resolution. Energy resolution for single crystals at one irradiation depth was around 65% full-width half-maximum (FWHM). A DOI resolution of approximately 6 mm was obtained for the modules. Timing resolution was in the range of 5.1-7.8 ns. An array assembled in the laboratory and coupled with WLS fibers had the best DOI resolution; the same array with clear fibers had the best timing resolution and a commercially manufactured array and coupled with WLS fibers had the best energy resolution.
Figures


References
-
- Andreaco MS, Williams CW, Moyers JC, Vaigneur K. Method for producing a high resolution detector array. United States Patent 6,749,761 2004.
-
- Budinger TF, Derenzo SE, Huesman RH, Jagust WJ, Valk PE. High resolution positron emission tomography for medical science studies. Acta Radiol. 1991;376:15–23. - PubMed
-
- Burr KC, Ivan A, LeBlanc J, Zelakiewicz S, McDaniel DL, Kim CL, Ganin A, Shah KS, Grazioso R, Farrell R, Glodo J. Evaluation of a position sensitive avalanche photodiode for PET. IEEE Transactions on Nuclear Science. 2003;50:792–6.
-
- Cherry SR, Shao Y, Silverman RW, Meadors K, Siegel S, Chatziioannou AF, Young JW, Jones WF, Moyers JC, Newport D, Boutefnouchet A, Farquhar TH, Andreaco M, Paulus MJ, Binkley DM, Nutt R, Phelps ME. MicroPET: A High Resolution PET Scanner for Imaging Small Animals. IEEE Transactions on Nuclear Science. 1997;44:1161–6.
-
- Du H, Yang Y, Cherry SR. Measurements of wavelength shifting (WLS) fibre readout for a highly multiplexed, depth-encoding PET detector. Physics in Medicine and Biology. 2007;52:2499–514. - PubMed
Publication types
MeSH terms
Substances
Grants and funding
LinkOut - more resources
Full Text Sources
Miscellaneous