Review
. 2008 May-Jun;42(5):627-35.
doi: 10.1097/MCG.0b013e31815ea291.

Esophageal motility disorders in terms of pressure topography: the Chicago Classification

Affiliations
Review

Esophageal motility disorders in terms of pressure topography: the Chicago Classification

Peter J Kahrilas et al. J Clin Gastroenterol. 2008 May-Jun.

Abstract

Two recent advances have revolutionized the performance of clinical esophageal manometry; the introduction of practical high resolution manometry (HRM) systems and the development of sophisticated algorithms to display the expanded manometric dataset as pressure topography plots. We utilized a large clinical experience of 400 consecutive patients and 75 control subjects to develop a systematic approach to analyzing esophageal motility using HRM and pressure topography plots. The resultant classification scheme has been named as the Chicago Classification of esophageal motility. Two strengths of pressure topography plots compared with conventional manometric recordings were the ability to (1) delineate the spatial limits, vigor, and integrity of individual contractile segments along the esophagus and (2) to distinguish between loci of compartmentalized intraesophageal pressurization and rapidly propagated contractions. Making these distinctions objectified the identification of distal esophageal spasm, vigorous achalasia, functional obstruction, and nutcracker esophagus subtypes. Applying these distinctions made the diagnosis of spastic disorders quite rare: spasm in 1.5% of patients, vigorous achalasia in 1.5%, and a newly defined entity, spastic nutcracker, in 1.5%. Ultimately, further clinical experience will be the judge, but it is our expectation that pressure topography analysis of HRM data, along with its well-defined functional implications, will prove valuable in the clinical management of esophageal motility disorders.


Conflict of interest statement

The authors declare no conflict of interest.

Figures

FIGURE 1
FIGURE 1
Typical pressure topography of a swallow spanning the entire esophagus from the pharynx (locations 0 to 2 cm) to stomach (locations 32 to 35 cm) of a normal subject with normal peristalsis and normal EGJ relaxation. Note that the transition zone demarcating the end of the proximal esophageal segment (striated muscle) and the beginning of the distal esophageal segment (smooth muscle) is readily identified as the pressure minimum between the sphincters. The classification scheme described herein encompasses the distal esophagus and the EGJ. The onset of the deglutitive relaxation window is defined by the onset of upper sphincter relaxation whereas the offset is 10 seconds later. The spatial domain within which EGJ relaxation is assessed is user defined, spanning at least 6 cm, depending on the extent of EGJ shortening after the swallow.
FIGURE 2
FIGURE 2
Methodology for calculating deglutitive EGJ relaxation. A, The cumulative duration of EGJ relaxation within the relaxation window detailed in Figure 1 as the threshold relaxation pressure cutoff was increased; for example, for a relaxation pressure cutoff of 10mm Hg, the period of relaxation was about 5 seconds. B, X-y transposition of Panel A illustrating the marginal relaxation pressure as the specified duration of relaxation is increased from 0 to 10 seconds. This plot was used to calculate the 3 and 4 seconds IRP values (indicated), which are the integrals of the curve (shaded) divided by 3 or 4 seconds, respectively. The 3-second nadir eSleeve measure of deglutitive relaxation is quantitatively similar to both the 3 and 4 seconds IRP values but has the requirement that the relaxation period analyzed be contiguous leaving it subject to crural diaphragm artifact in individuals with rapid respiration.
FIGURE 3
FIGURE 3
Derivation of the pressurization front velocity (PFV) from 30-mm Hg isobaric contour plots. The heavy black line delineates the pressure domain ≥30mm Hg. To calculate the PFV, the distal temporal margin of the transition zone (point 1) and the proximal margin of the EGJ on the 30-mm Hg isobaric contour (point 2) were localized by hand. The slope of the line connecting the 2 points was the PFV, expressed in cm/s.
FIGURE 4
FIGURE 4
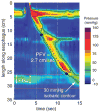
Three circumstances of abnormal PFV: failed peristalsis, hypotensive peristalsis, and a rapid PFV. In the instance of failed peristalsis, no pressure domain exists within the distal esophageal segment greater than the 30-mm Hg isobaric contour whereas with the hypotensive contraction the 30-mm Hg isobaric contour is incomplete (compare to Fig. 2). Note that the example of the rapid PFV is attributable to compartmentalized esophageal pressurization in the setting of obviously impaired deglutitive EGJ relaxation (the EGJ pressure is never <30mm Hg).
FIGURE 5
FIGURE 5
Differentiating a rapid PFV attributable to compartmentalized esophageal pressurization (top) from a rapidly propagated contraction (bottom). The upper panel illustrates a swallow with functional obstruction at the EGJ. Note that the 30-mm Hg isobaric contour domain (black) deviates quickly from the propagating contractile wavefront highlighted by the 50-mm Hg isobaric contour line. The PFV of the 30-mm Hg isobaric contour domain is 8.2 cm/s and would fit criteria for a rapid contraction. However, the pressurization front velocity of the 50-mm Hg isobaric contour would be normal. In contrast, the lower panel represents a swallow with rapid PFV attributable to spasm. The 30 and 50-mm Hg isobaric contours parallel each other indicating that no compartmentalized esophageal pressurization has occurred. The entire distal esophagus is contracting simultaneously.
FIGURE 6
FIGURE 6
Derivation of the DCI. Conceptually, if the isobaric contour plot of distal esophageal contraction is envisioned as a 3-dimensional solid, the footprint of the solid is time multiplied by length of the distal esophageal segment (cm) and the height of the solid is pressure. The distal contractile integral is the volume of that solid spanning from 20mm Hg at the base to its peak, expressed as mm Hg s cm.
FIGURE 7
FIGURE 7
Distal contractile integral of a patient with an extreme example of spastic nutcracker. Note the PFV is normal (3.0 cm/s). The contraction has a spastic component that occurs after the wavefront propagates to the EGJ. Typical of patients with a PFV>8000mm Hg s cm, this patient had chest pain and dysphagia.
FIGURE 8
FIGURE 8
Heterogeneity of hypertensive peristalsis. The left panel represents nutcracker esophagus defined a distal contractile integral greater than 5000mm Hg s cm and a normal PFV. The dashed lines represent conventional measurement points of 3 and 8 cm above the LES and this patient would fulfill conventional criteria for nutcracker esophagus. The center panel represents another patient with a distal contractile integral greater than 5000mm Hg s cm, however, this patient would have been missed by conventional measurement as the hypercontractile focus is limited to a short segment in the distal esophagus. The right panel illustrates a patient with nutcracker LES; the hypertensive contraction is limited to the sphincter segment after contraction.
FIGURE 9
FIGURE 9
Typical advanced achalasia with a nonrelaxing LES and minimal pressure activity within the dilated esophageal lumen.
FIGURE 10
FIGURE 10
The distinction between achalasia associated with pan-esophageal pressurization (left) and vigorous achalasia (right). In each case, the black line indicates the 30-mm Hg isobaric pressure contour and both examples have an abnormal eSleeve 3-second nadir LES relaxation measurement.
FIGURE 11
FIGURE 11
Pressure topography plots illustrating mild functional obstruction in a postfundoplication patient (left) and severe functional obstruction in a patient with eosinophilic esophagitis (right). Because the intrabolus pressure never exceeds 30mm Hg, the PFV is normal in the patient with mild functional obstruction. However, in the patient with severe functional obstruction, the PFV is >8 cm/s and proceeded by a period of pan-esophageal pressurization.

References

    1. Pandolfino JE, Zhang Q, Ghosh SK, et al. tLESRs and reflux: mechanistic analysis using concurrent fluoroscopy and high-resolution manometry. Gastroenterology. 2006;131:1725–1733. - PubMed
    1. Clouse RE, Staiano A. Topography of the esophageal peristaltic pressure wave. Am J Physiol. 1991;261:G677–G684. - PubMed
    1. Clouse RE, Staiano A, Alrakawi A, et al. Application of topographical methods to clinical esophageal manometry. Am J Gastroenterol. 2000;95:2720–2730. - PubMed
    1. Pandolfino JE, Ghosh SK, Zhang Q, et al. Quantifying EGJ morphology and relaxation with high-resolution manometry: a study of 75 asymptomatic volunteers. Am J Physiol (Gastrointest Liver Physiol) 2006;290:G1033–G1040. - PubMed
    1. Ghosh SK, Pandolfino JE, Zhang Q, et al. Quantifying esophageal peristalsis with high-resolution manometry: a study of 75 asymptomatic volunteers. Am J Physiol (Gastrointest Liver Physiol) 2006;290:G988–G997. - PubMed

Publication types

MeSH terms