. 2008:4:178.
doi: 10.1038/msb.2008.12. Epub 2008 Mar 25.

Metabolic model integration of the bibliome, genome, metabolome and reactome of Aspergillus niger

Affiliations

Metabolic model integration of the bibliome, genome, metabolome and reactome of Aspergillus niger

Mikael Rørdam Andersen et al. Mol Syst Biol. 2008.

Abstract

The release of the genome sequences of two strains of Aspergillus niger has allowed systems-level investigations of this important microbial cell factory. To this end, tools for doing data integration of multi-ome data are necessary, and especially interesting in the context of metabolism. On the basis of an A. niger bibliome survey, we present the largest model reconstruction of a metabolic network reported for a fungal species. The reconstructed gapless metabolic network is based on the reportings of 371 articles and comprises 1190 biochemically unique reactions and 871 ORFs. Inclusion of isoenzymes increases the total number of reactions to 2240. A graphical map of the metabolic network is presented. All levels of the reconstruction process were based on manual curation. From the reconstructed metabolic network, a mathematical model was constructed and validated with data on yields, fluxes and transcription. The presented metabolic network and map are useful tools for examining systemwide data in a metabolic context. Results from the validated model show a great potential for expanding the use of A. niger as a high-yield production platform.


Figures

Figure 1
Figure 1
Statistics of the reconstructed A. niger metabolic network. Top bar shows the support for the 1190 unique reactions. Middle bar shows the distribution of the references according to specificity. The bottom bar shows the reactions constituting the ‘orphans'—reactions with no supporting ORF or literature.
Figure 2
Figure 2
Metabolic map. The metabolic map of A. niger (Supplementary Figure 1) is showed in reduced size. An example of the level of detail is shown for the citric acid cycle.
Figure 3
Figure 3
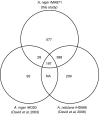
Venn diagram of reaction statistics for three Aspergillus models. The diagram shows the number of unique reactions shared and specific for the three models. Overlap between A. nidulans iHD666 and A. niger iHD20 was not investigated.
Figure 4
Figure 4
Comparison of measured oah deletion fluxes to predicted values. Values in black (lower) are the calculated fluxes based on 13C labeling, wt/Δoah. Red values (upper) are predicted with A. niger iMA871. Parts of the figure in black are from Pedersen et al (2000b).
Figure 5
Figure 5
Predicted activities of respiratory pathways in citric acid fermentations. In phase A, the standard respiratory pathway is the sole source of NADH turnover. In phase B, the proton-pumping NADH dehydrogenase is substituted for the non-proton-pumping NADH-ubiquinone oxidoreductase, resulting in a pathway that is a meld of the alternative oxidase pathway and the standard oxidative pathway. In phase C, the cytochrome pathway is substituted for the alternative oxidase pathway. The net result is a decreasing amount of ATP produced per metabolized NADH as the citric acid yield increases, resulting in a changing P/O ratio.
Figure 6
Figure 6
Genes expressed in central carbon metabolism when A. niger CBS 513.88 is grown on glucose. Red box: at least one isoenzyme of this process is present; green box: all absent; gray box: no ORF has been assigned to the process.
Figure 7
Figure 7
Radar plots of the theoretical maximum yields of selected metabolites from glucose and ammonium. Value axis shows percentage of C moles of the metabolite from glucose; 100% denotes a full conversion of glucose to the product. Plot (A) shows the twelve essential precursor metabolites as defined in (Stephanopoulos et al, 1998). Plot (B) shows the 20 common amino acids. Plot (C) shows selected organic acids.
Figure 8
Figure 8
Overview of the model reconstruction process. Pathway addition was based on the reported presence of products and/or enzyme activities reported for A. niger. This was supplemented with enzymes reported present in other aspergilli. Pathway databases (KEGG) were used where possible to fill gaps in pathways. If necessary, reactions were inferred to close the remaining gaps. Finally, ORFs were connected to reactions using the CBS 513.88 sequence annotation. No new reactions were added based solely on sequence information.

Similar articles

Cited by

References

    1. Baker SE (2006) Aspergillus niger genomics: past, present and into the future. Med Mycol 44: S17–S21 - PubMed
    1. Borodina I, Krabben P, Nielsen J (2005) Genome-scale analysis of Streptomyces coelicolor A3(2) metabolism. Genome Res 15: 820–829 - PMC - PubMed
    1. Brennan PJ, Griffin PFS, Lösel DM, Tyrrell D (1974) The lipids of fungi. Prog Chem Fats Other Lipids 14: 49–89 - PubMed
    1. Byrne PF, Brennan PJ (1976) Isolation and characterization of inositol-containing glycosphingolipids from Aspergillus niger. Biochem Soc Trans 4: 893–895 - PubMed
    1. Chattopadhyay P, Banerjee SK, Sen K, Chakrabarti P (1985) Lipid profiles of Aspergillus niger and its unsaturated fatty acid auxotroph, UFA2. Can J Microbiol 31: 352–355 - PubMed

Publication types