

Probabilistic inference of transcription factor binding from multiple data sources
- PMID: 18364997
- PMCID: PMC2268002
- DOI: 10.1371/journal.pone.0001820
Probabilistic inference of transcription factor binding from multiple data sources
Abstract
An important problem in molecular biology is to build a complete understanding of transcriptional regulatory processes in the cell. We have developed a flexible, probabilistic framework to predict TF binding from multiple data sources that differs from the standard hypothesis testing (scanning) methods in several ways. Our probabilistic modeling framework estimates the probability of binding and, thus, naturally reflects our degree of belief in binding. Probabilistic modeling also allows for easy and systematic integration of our binding predictions into other probabilistic modeling methods, such as expression-based gene network inference. The method answers the question of whether the whole analyzed promoter has a binding site, but can also be extended to estimate the binding probability at each nucleotide position. Further, we introduce an extension to model combinatorial regulation by several TFs. Most importantly, the proposed methods can make principled probabilistic inference from multiple evidence sources, such as, multiple statistical models (motifs) of the TFs, evolutionary conservation, regulatory potential, CpG islands, nucleosome positioning, DNase hypersensitive sites, ChIP-chip binding segments and other (prior) sequence-based biological knowledge. We developed both a likelihood and a Bayesian method, where the latter is implemented with a Markov chain Monte Carlo algorithm. Results on a carefully constructed test set from the mouse genome demonstrate that principled data fusion can significantly improve the performance of TF binding prediction methods. We also applied the probabilistic modeling framework to all promoters in the mouse genome and the results indicate a sparse connectivity between transcriptional regulators and their target promoters. To facilitate analysis of other sequences and additional data, we have developed an on-line web tool, ProbTF, which implements our probabilistic TF binding prediction method using multiple data sources. Test data set, a web tool, source codes and supplementary data are available at: http://www.probtf.org.
Conflict of interest statement
Figures


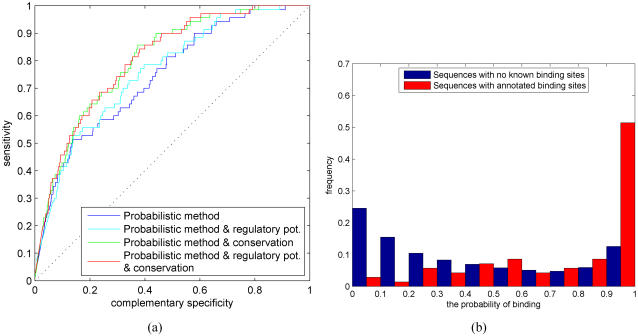
 , i = 0,1,…,10, although the two histograms are shown side by side.


Similar articles
-
PhyloGibbs: a Gibbs sampling motif finder that incorporates phylogeny.PLoS Comput Biol. 2005 Dec;1(7):e67. doi: 10.1371/journal.pcbi.0010067. Epub 2005 Dec 9. PLoS Comput Biol. 2005. PMID: 16477324 Free PMC article.
-
Efficient inference for sparse latent variable models of transcriptional regulation.Bioinformatics. 2017 Dec 1;33(23):3776-3783. doi: 10.1093/bioinformatics/btx508. Bioinformatics. 2017. PMID: 28961802 Free PMC article.
-
MotEvo: integrated Bayesian probabilistic methods for inferring regulatory sites and motifs on multiple alignments of DNA sequences.Bioinformatics. 2012 Feb 15;28(4):487-94. doi: 10.1093/bioinformatics/btr695. Bioinformatics. 2012. PMID: 22334039
-
Bayesian models and Markov chain Monte Carlo methods for protein motifs with the secondary characteristics.J Comput Biol. 2005 Sep;12(7):952-70. doi: 10.1089/cmb.2005.12.952. J Comput Biol. 2005. PMID: 16201915 Review.
-
Computational framework for the prediction of transcription factor binding sites by multiple data integration.BMC Neurosci. 2006 Oct 30;7 Suppl 1(Suppl 1):S8. doi: 10.1186/1471-2202-7-S1-S8. BMC Neurosci. 2006. PMID: 17118162 Free PMC article. Review.
Cited by
-
An integrative computational systems biology approach identifies differentially regulated dynamic transcriptome signatures which drive the initiation of human T helper cell differentiation.BMC Genomics. 2012 Oct 30;13:572. doi: 10.1186/1471-2164-13-572. BMC Genomics. 2012. PMID: 23110343 Free PMC article.
-
Mechanisms and evolution of control logic in prokaryotic transcriptional regulation.Microbiol Mol Biol Rev. 2009 Sep;73(3):481-509, Table of Contents. doi: 10.1128/MMBR.00037-08. Microbiol Mol Biol Rev. 2009. PMID: 19721087 Free PMC article. Review.
-
A protein-protein interaction guided method for competitive transcription factor binding improves target predictions.Nucleic Acids Res. 2009 Dec;37(22):e146. doi: 10.1093/nar/gkp789. Nucleic Acids Res. 2009. PMID: 19786498 Free PMC article.
-
Epigenetic priors for identifying active transcription factor binding sites.Bioinformatics. 2012 Jan 1;28(1):56-62. doi: 10.1093/bioinformatics/btr614. Epub 2011 Nov 8. Bioinformatics. 2012. PMID: 22072382 Free PMC article.
-
Increasing coverage of transcription factor position weight matrices through domain-level homology.PLoS One. 2012;7(8):e42779. doi: 10.1371/journal.pone.0042779. Epub 2012 Aug 27. PLoS One. 2012. PMID: 22952610 Free PMC article.
References
-
- Davidson EH. Genomic Regulatory Systems: Development and Evolution. Academic Press, 1st edition; 2001.
-
- Tompa M, Li N, Bailey TL, Church GM, De Moor B, et al. Assessing computational tools for the discovery of transcription factor binding sites. Nature Biotechnology. 2005;23:137–144. - PubMed
-
- Hughes JD, Estep PW, Tavazoie S, Church GM. Computational identification of Cis-regulatory elements associated with groups of functionally related genes in Saccharomyces cerevisiae. Journal of Molecular Biology. 2000;296:1205–1214. - PubMed
-
- Kellis M, Patterson N, Endrizzi M, Birren B, Lander ES. Sequencing and comparison of yeast species to identify genes and regulatory elements. Nature. 2003;423:241–254. - PubMed
Publication types
MeSH terms
Substances
Grants and funding
LinkOut - more resources
Full Text Sources
Miscellaneous
