. 2008 Mar 26;3(3):e1848.
doi: 10.1371/journal.pone.0001848.

Neuroarchitecture of aminergic systems in the larval ventral ganglion of Drosophila melanogaster

Affiliations

Neuroarchitecture of aminergic systems in the larval ventral ganglion of Drosophila melanogaster

Matthias Vömel et al. PLoS One. .

Abstract

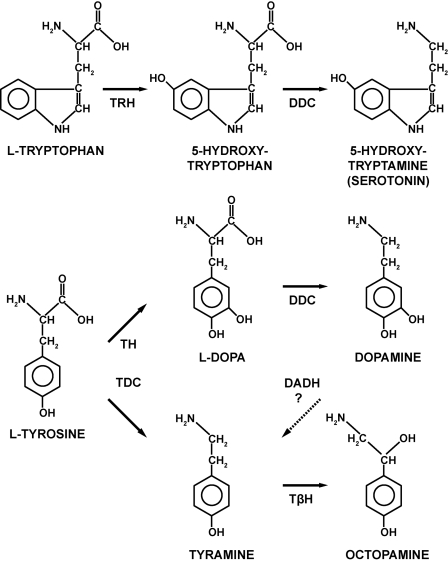
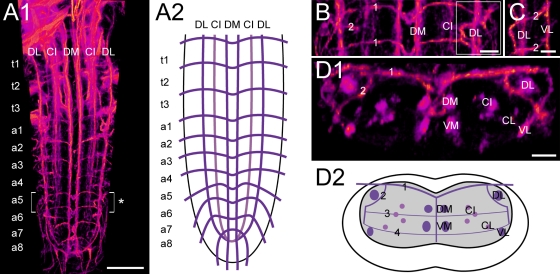
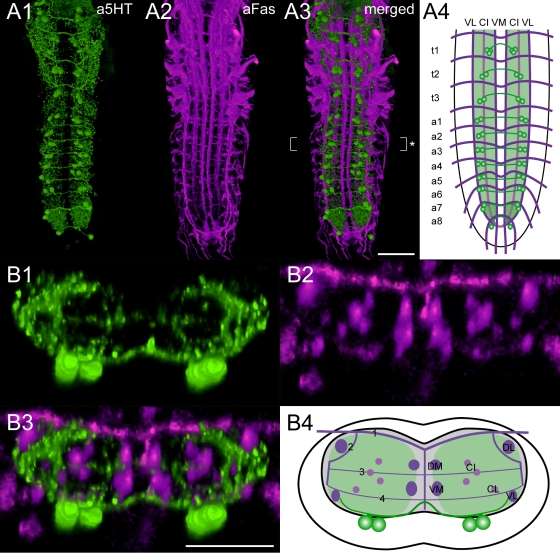
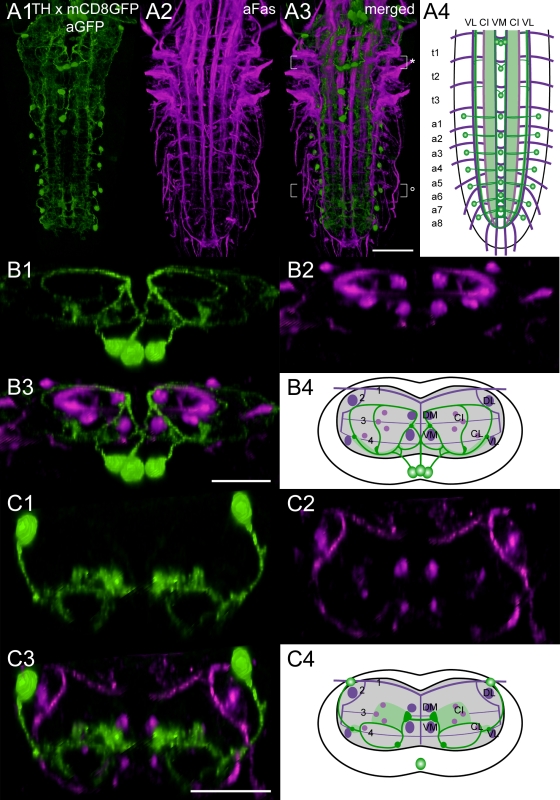
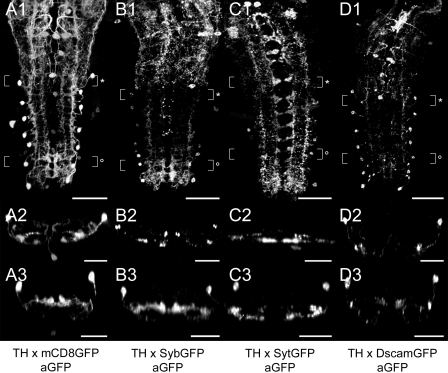
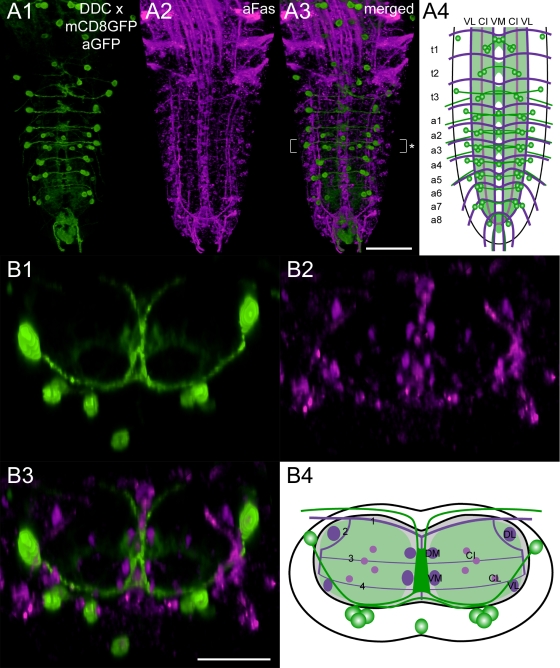
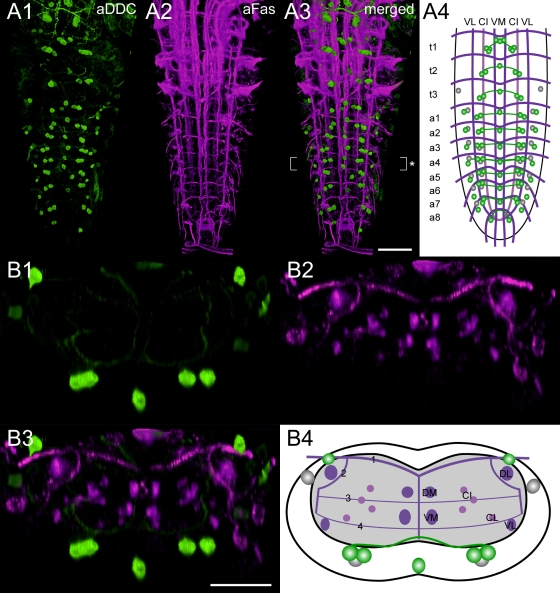
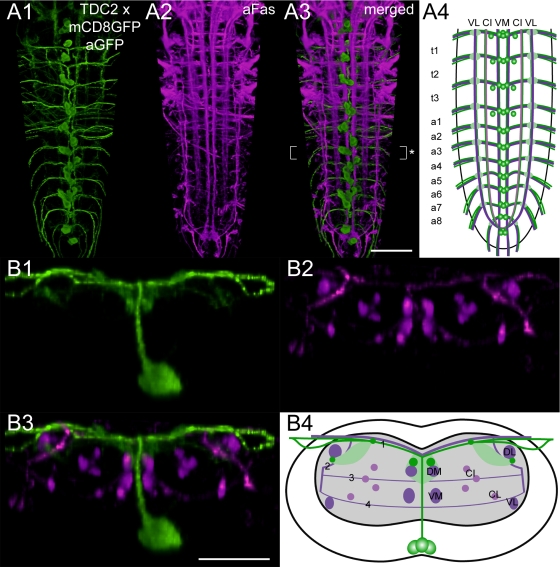
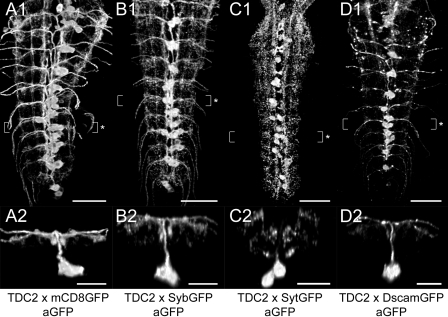
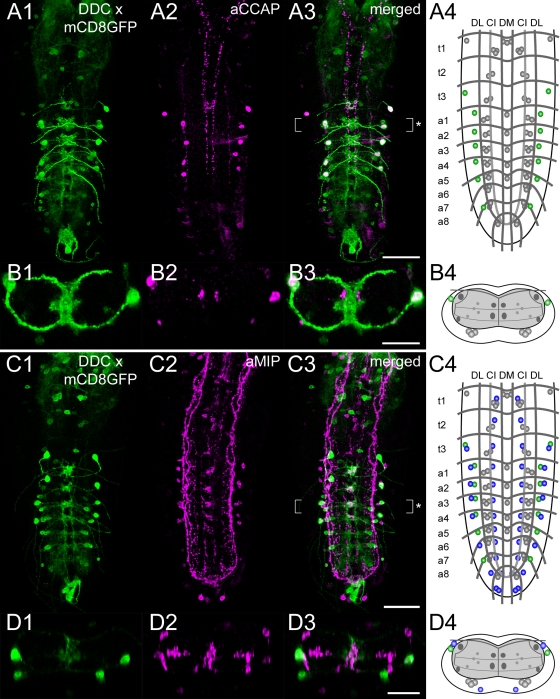
Biogenic amines are important signaling molecules in the central nervous system of both vertebrates and invertebrates. In the fruit fly Drosophila melanogaster, biogenic amines take part in the regulation of various vital physiological processes such as feeding, learning/memory, locomotion, sexual behavior, and sleep/arousal. Consequently, several morphological studies have analyzed the distribution of aminergic neurons in the CNS. Previous descriptions, however, did not determine the exact spatial location of aminergic neurite arborizations within the neuropil. The release sites and pre-/postsynaptic compartments of aminergic neurons also remained largely unidentified. We here used gal4-driven marker gene expression and immunocytochemistry to map presumed serotonergic (5-HT), dopaminergic, and tyraminergic/octopaminergic neurons in the thoracic and abdominal neuromeres of the Drosophila larval ventral ganglion relying on Fasciclin2-immunoreactive tracts as three-dimensional landmarks. With tyrosine hydroxylase- (TH) or tyrosine decarboxylase 2 (TDC2)-specific gal4-drivers, we also analyzed the distribution of ectopically expressed neuronal compartment markers in presumptive dopaminergic TH and tyraminergic/octopaminergic TDC2 neurons, respectively. Our results suggest that thoracic and abdominal 5-HT and TH neurons are exclusively interneurons whereas most TDC2 neurons are efferent. 5-HT and TH neurons are ideally positioned to integrate sensory information and to modulate neuronal transmission within the ventral ganglion, while most TDC2 neurons appear to act peripherally. In contrast to 5-HT neurons, TH and TDC2 neurons each comprise morphologically different neuron subsets with separated in- and output compartments in specific neuropil regions. The three-dimensional mapping of aminergic neurons now facilitates the identification of neuronal network contacts and co-localized signaling molecules, as exemplified for DOPA decarboxylase-synthesizing neurons that co-express crustacean cardioactive peptide and myoinhibiting peptides.


Conflict of interest statement

Competing Interests: The authors have declared that no competing interests exist.

Figures

Figure 1
Figure 1. Synthetic pathways for serotonin, dopamine, tyramine, and octopamine.
The amino acid tryptophan is the starting point for the synthesis of 5-hydroxytryptamine (5-HT, serotonin), whereas tyrosine is the source for dopamine as well as tyramine and octopamine. An alternative pathway (dotted arrow) via DADH may exist that permits the synthesis of tyramine from dopamine. DADH: dopamine dehydroxylase; DDC: DOPA decarboxylase; TβH: tyramine β-hydroxylase; TDC: tyrosine decarboxylase; TH: tyrosine hydroxylase; TRH: tryptophan hydroxylase.
Figure 2
Figure 2. The Fasciclin2 landmark system in the Drosophila larval VG.
A1) Dorsal view of a 3D image stack showing volume-rendered Fas2-immunoreactive tracts in the thoracic (t1-3) and abdominal neuromeres (a1-8) of the L3 larval VG, and A2) the deduced idealized dorsal scheme. B) Detailed dorsal and C) lateral view of a5 and adjacent neuromeres (* in A1). D1) Transversal view of a5, and D2) the deduced idealized transversal scheme. Longitudinal projections are named according to their relative dorso-ventral (D: dorsal, C: central, V: ventral) and medio-lateral (M: medial, I: intermedial, L: lateral) position. For example, the two dorso-medial Fas2-immunoreactive tracts are referred to as DM tracts. Transversal projections (TP) are numbered according to their relative dorso-ventral position, i.e. “1” represents the topmost TP . Scale bars: 50 µm in A), 10 µm in B), C), and D).
Figure 3
Figure 3. Mapping of 5-HT-immunoreactive neurons.
Ventral view of 3D image stacks showing volume-rendered A1) 5-HT-immunoreactive neurons (green) and A2) Fas2-positive tracts (magenta) in a larval VG. The merged image (A3) served for an idealized schematic representation of presumed 5-HT neurons in the Fas2 landmark system (A4). B1-3) Corresponding transversal views of the neuromere a2 (* in A3), and B4) the deduced idealized transversal scheme. Green-shaded areas in the schemes contain a high concentration of 5-HT-immunoreactive arborizations. Scale bars: 50 µm in A), 25 µm in B).
Figure 4
Figure 4. Mapping of Th-gal4 x mCD8GFP expressing neurons.
A1) Ventral view of 3D image stacks showing volume-rendered GFP-immunoreactive neurons (green) and A2) Fas2-positive tracts (magenta) in a larva expressing Th-gal4-driven mCD8GFP. The merged image (A3) served for an idealized schematic representation of Th-gal4 x mCD8GFP expressing neurons in the Fas2 landmark system (A4). B1-3) Corresponding transversal views of the neuromere t1 (* in A3), and B4) the deduced idealized scheme. C1-3) Transversal views, and C4) idealized scheme of a5 (° in A3). Note that the idealized schemes A4) and C4) include the vmTH neurons of a1-7, which often lacked Th-gal4-driven mCD8GFP expression. These neurons, however, always showed strong TH immunoreactivity (see Fig. S2). Green-shaded areas in the schemes contain a high concentration of GFP-immunoreactive arborizations. Scale bars: 50 µm in A), 25 µm in B) and C).
Figure 5
Figure 5. Distribution of ectopically expressed neuronal compartment markers in TH neurons.
A1-D1) Dorsal view of GFP immunoreactivity in the VG of larvae expressing Th-gal4-driven mCD8GFP (A1-3), SybGFP (B1-3), SytGFP (C1-3), or DscamGFP (D1-3). A2-D2) Corresponding transversal views of the neuromeres t3 or a1 (* in A1-D1). A3-D3) Additional transversal views showing the compartment marker distribution in a5/6 (° in A1-D1). All images are auto-contrasted maximum pixel intensity projections of volume-rendered 3D image stacks. Scale bars: 50 µm in A1-D1), 25 µm in A2-D2) and A3-D3).
Figure 6
Figure 6. Mapping of Ddc-gal4 x mCD8GFP expressing neurons.
A1) Ventral view of 3D image stacks showing volume-rendered GFP-immunoreactive neurons (green) and A2) Fas2-positive tracts (magenta) in a larva expressing Ddc-gal4-driven mCD8GFP. The merged image (A3) served for an idealized schematic representation of Ddc-gal4 x mCD8GFP expressing neurons in the Fas2 landmark system (A4). B1-3) Corresponding transversal views of the neuromere a4 (* in A3), and B4) the deduced idealized scheme. Note that the Ddc-gal4 driver typically drives mCD8GFP expression in most, but not all presumed DDC neurons of the VG (see Fig. S3 and S4). Thus, some presumed DDC neurons are not included in the idealized schemes shown here. Green-shaded areas in the schemes contain a high concentration of GFP-immunoreactive arborizations. Scale bars: 50 µm in A), 25 µm in B) and C).
Figure 7
Figure 7. Mapping of DDC-immunoreactive neurons.
A1) Ventral view of 3D image stacks showing volume-rendered DDC-immunoreactive neurons (green) and A2) Fas2-positive tracts (magenta) in a larval VG. The merged image (A3) served for an idealized schematic representation of DDC-immunoreactive neurons in the Fas2 landmark system (A4). B1-3) Corresponding transversal views of the neuromere a4 (* in A3), and B4) the deduced idealized scheme. Besides the aminergic neurons, the DDC antiserum also faintly labeled presumed peptidergic neurons, which are shown in gray in the schemes. Noteworthy, these peptidergic neurons are also present in the Ddc-gal4 expression pattern (see Fig. 6). Scale bars: 50 µm in A), 25 µm in B).
Figure 8
Figure 8. Mapping of Tdc2-gal4 x mCD8GFP expressing neurons.
A1) Ventral view of 3D image stacks showing volume-rendered GFP-immunoreactive neurons (green) and A2) Fas2-positive tracts (magenta) in a larva expressing Tdc2-gal4-driven mCD8GFP. The merged image (A3) served for an idealized schematic representation of Tdc2-gal4 x mCD8GFP expressing neurons in the Fas2 landmark system (A4). B1-3) Corresponding transversal views of the neuromere a3 (* in A3), and B4) the deduced idealized scheme. Note that the idealized scheme A4) includes the pmTDC2 neurons of t1-3 and a1, which often faintly expressed Tdc2-gal4-driven mCD8GFP. The pmTDC2 neurons, however, always showed strong TβH immunoreactivity (see Fig. S5). Green-shaded areas in the schemes contain a high concentration of GFP-immunoreactive arborizations. Scale bars: 50 µm in A), 25 µm in B).
Figure 9
Figure 9. Distribution of ectopically expressed neuronal compartment markers in TDC2 neurons.
(A1-D1) Dorsal view of GFP immunoreactivity in the VG of larvae expressing Tdc2-gal4-driven mCD8GFP (A1-2), SybGFP (B1-2), SytGFP (C1-2), or DscamGFP (D1-2). (A2-D2) Corresponding transversal views of the neuromeres a3 or a4 (* in A1-D1). All images are auto-contrasted maximum pixel intensity projections of volume-rendered 3D image stacks. Scale bars: 50 µm in A1-D1), 25 µm in A2-D2).
Figure 10
Figure 10. Fas2-based comparison of Ddc-gal4-driven mCD8GFP expression and CCAP/MIP immunoreactivity in the larval VG.
A1) Dorsal view of Ddc-gal4 x mCD8GFP expressing neurons (green) and A2) CCAP-immunoreactive neurons (magenta) in a larval VG. The merged image (A3) served for an idealized schematic representation of the respective neuron groups in the Fas2 landmark system (A4). B1-3) Corresponding transversal views of the neuromere a1 (* in A3), and B4) the deduced idealized scheme. C1) Dorsal view of Ddc-gal4 x mCD8GFP expressing neurons (green) and C2) MIP-immunoreactive neurons (magenta) in a larval VG. The merged image (C3) provided the basis for the scheme shown in (C4). D1-3) Corresponding transversal views of the neuromere a3 (* in C3), and D4) the deduced idealized scheme. In all schemes, neurons showing both Ddc-gal4-driven mCD8GFP expression and CCAP/MIP immunoreactivity are green-colored. Ddc-gal4 x mCD8GFP expressing neurons which lacked CCAP/MIP immunoreactivity are shown in gray. Vice versa, neurons which exclusively showed CCAP/MIP immunoreactivity are blue-colored. Original images are maximum pixel intensity projections of volume-rendered 3D image stacks. Scale bars: 50 µm in A) and C), 25 µm in B) and D).

Similar articles

Cited by

References

    1. Monastirioti M. Biogenic amine systems in the fruit fly Drosophila melanogaster. Microsc Res Tech. 1999;45:106–121. - PubMed
    1. Nässel DR. Neuropeptides, amines and amino acids in an elementary insect ganglion: functional and chemical anatomy of the unfused abdominal ganglion. Prog Neurobiol. 1996;48:325–420. - PubMed
    1. Pflüger HJ, Stevenson PA. Evolutionary aspects of octopaminergic systems with emphasis on arthropods. Arthropod Structure & Development. 2005;34:379–396.
    1. Roeder T. Tyramine and octopamine: ruling behavior and metabolism. Annu Rev Entomol. 2005;50:447–477. - PubMed
    1. Brody T, Cravchik A. Drosophila melanogaster G protein-coupled receptors. J Cell Biol. 2000;150:F83–F88. - PMC - PubMed

Publication types

Substances

LinkOut - more resources