. 2008 Apr 23;130(16):5492-8.
doi: 10.1021/ja710520q. Epub 2008 Mar 26.

Analysis of the cryptophycin P450 epoxidase reveals substrate tolerance and cooperativity

Affiliations

Analysis of the cryptophycin P450 epoxidase reveals substrate tolerance and cooperativity

Yousong Ding et al. J Am Chem Soc. .

Abstract

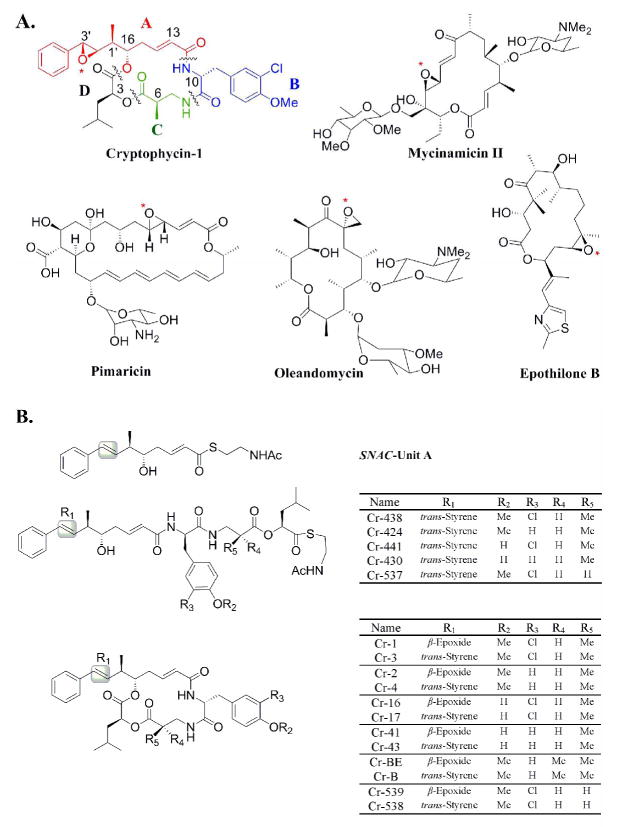
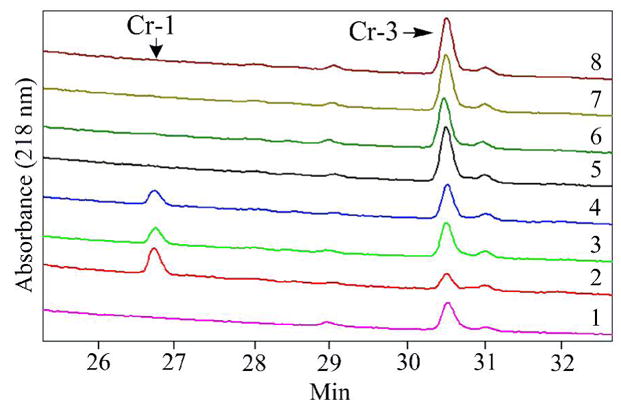
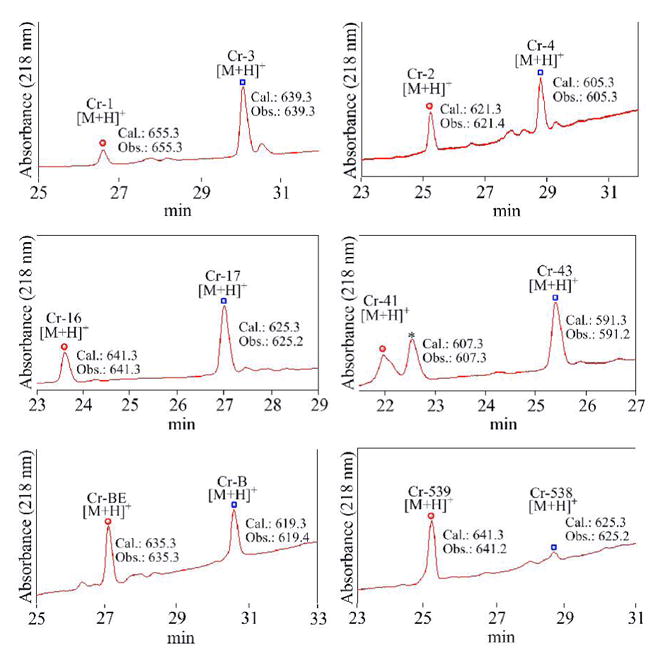
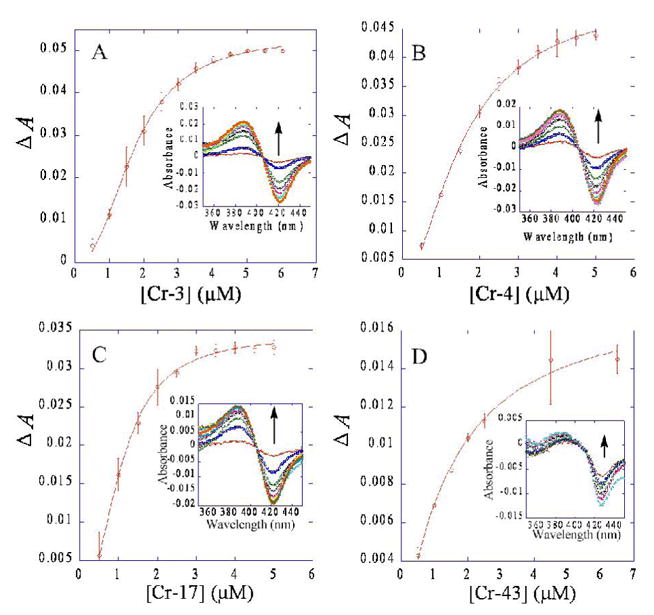
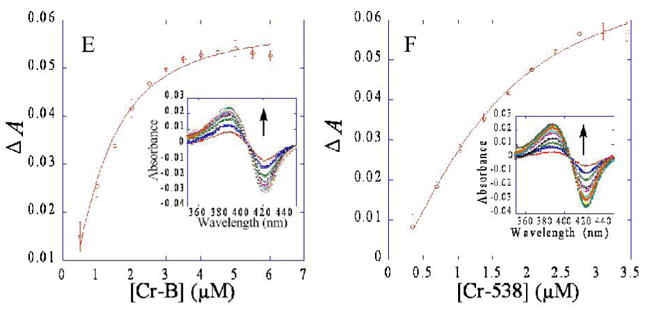
Cryptophycins are potent anticancer agents isolated from Nostoc sp. ATCC 53789 and Nostoc sp. GSV 224. The most potent natural cryptophycin analogues retain a beta-epoxide at the C2'-C3' position of the molecule. A P450 epoxidase encoded by c rpE recently identified from the cryptophycin gene cluster was shown to install this key functional group into cryptophycin-4 (Cr-4) to produce cryptophycin-2 (Cr-2) in a regio- and stereospecific manner. Here we report a detailed characterization of the CrpE epoxidase using an engineered maltose binding protein (MBP)-CrpE fusion. The substrate tolerance of the CrpE polypeptide was investigated with a series of structurally related cryptophycin analogues generated by chemoenzymatic synthesis. The enzyme specifically installed a beta-epoxide between C2' and C3' of cyclic cryptophycin analogues. The kcat/Km values of the enzyme were determined to provide further insights into the P450 epoxidase catalytic efficiency affected by substrate structural variation. Finally, binding analysis revealed cooperativity of MBP-CrpE toward natural and unnatural desepoxy cryptophycin substrates.


Figures

Figure 1
Figure 1
Chemical structure of several epoxy natural products and MBP-CrpE substrates. A: cryptophycin-1 (Cr-1) and other examples of natural products containing an epoxide moiety installed by P450s. B: six seco- and six cyclic cryptophycin substrates used in MBP-CrpE studies. The six observed reaction products are also shown.
Figure 2
Figure 2
Investigation of MBP-CrpE reaction system components. The standard enzyme reaction with Cr-3 as substrate contained MBP-CrpE, spinach ferredoxin (Fer), spinach ferredoxin NADP + reductase (FNR), glucose-6-phosphate, and glucose-6-phosphate dehydrogenase (G6PDH) in 100 μl of storage buffer, and was analyzed by HPLC-UV. Lane 1, standard Cr-3; lane 2, standard enzyme reaction; lane 3, standard reaction with CrpE replacing MBP-CrpE; lane 4, standard reaction omitting G6PDH; lane 5, standard reaction with E. coli flavodoxin (Fld) and NADPH-flavodoxin reductase (Fpr) instead of Fer and FNR; lane 6, standard reaction with rat NADP+ P450 reductase instead of Fer and FNR; lane 7, standard reaction omitting Fer; lane 8 the standard reaction omitting FNR. Only Fer and FNR were accepted by MBP-CrpE to produce Cr-1 from Cr-3. The presence of an NADPH regenerating system was not necessary for P450 activity. CrpE was capable of producing Cr-1 from Cr-3, although a decrease in overall production was observed. Thus, subsequent studies utilized MBP-CrpE as the enzyme source.
Figure 3
Figure 3
HPLC-UV and MS analyses of MBP-CrpE reactions with Cr-3, Cr-4, Cr-17, Cr-43, Cr-B, and Cr-538 as substrates. All substrates and products yielded the expected [M+H]+ values. The Blue squares and the red circles represent substrates and products, respectively. A single contaminant (labeled with dark star) was found in all reactions and is attributed to DMSO used to dissolve all substrates.
Figure 4
Figure 4
Spectral titration of 0.3 μM MBP-CrpE with Cr-3 (0.5–6 μM) (A), Cr-4 (0.5–5 μM) (B), Cr-17 (0.5–5 μM) (C), Cr-43 (0.5–6 μM) (D), Cr-B (0.5–6 μM) (E), and Cr-538 (0.35–3.5 μM)(F). The difference spectra resulting from different substrates are shown as insets (A to F). The direction of spectral shift upon substrate addition is shown (arrows). Absorbance changes were determined by subtracting A388 with A422 and were fitted to the equation ΔA = ΔAmaxSn/(Kdn+Sn).
Figure 4
Figure 4
Spectral titration of 0.3 μM MBP-CrpE with Cr-3 (0.5–6 μM) (A), Cr-4 (0.5–5 μM) (B), Cr-17 (0.5–5 μM) (C), Cr-43 (0.5–6 μM) (D), Cr-B (0.5–6 μM) (E), and Cr-538 (0.35–3.5 μM)(F). The difference spectra resulting from different substrates are shown as insets (A to F). The direction of spectral shift upon substrate addition is shown (arrows). Absorbance changes were determined by subtracting A388 with A422 and were fitted to the equation ΔA = ΔAmaxSn/(Kdn+Sn).

Similar articles

Cited by

References

    1. Welker M, von Dohren H. FEMS Microbiol Rev. 2006;30:530–563. - PubMed
    1. Clardy J, Fischbach MA, Walsh CT. Nat Biotechnol. 2006;24:1541–1550. - PubMed
    1. Schmidt EW, Nelson JT, Rasko DA, Sudek S, Eisen JA, Haygood MG, Ravel J. Proc Natl Acad Sci U S A. 2005;102:7315–7320. - PMC - PubMed
    1. Golakoti T, Yoshida WY, Chaganty S, Moore RE. J Nat Prod. 2001;64:54–59. - PubMed
    1. Schwartz RE, Hirsch CF, Sesin DF, Flor JE, Chartrain M, Fromtling RE, Harris GH, Salvatore MJ, Liesch JM, Yudin K. J Indust Microbiol. 1990;5:113–123.

Publication types

MeSH terms