

Social contacts and mixing patterns relevant to the spread of infectious diseases
- PMID: 18366252
- PMCID: PMC2270306
- DOI: 10.1371/journal.pmed.0050074
Social contacts and mixing patterns relevant to the spread of infectious diseases
Abstract
Background: Mathematical modelling of infectious diseases transmitted by the respiratory or close-contact route (e.g., pandemic influenza) is increasingly being used to determine the impact of possible interventions. Although mixing patterns are known to be crucial determinants for model outcome, researchers often rely on a priori contact assumptions with little or no empirical basis. We conducted a population-based prospective survey of mixing patterns in eight European countries using a common paper-diary methodology.
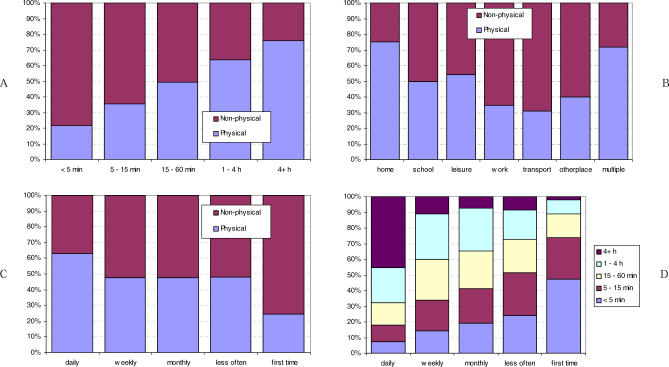
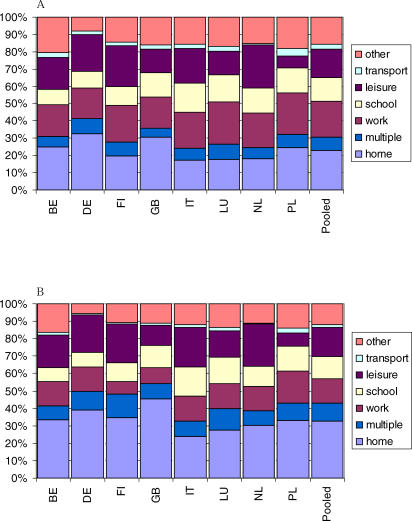
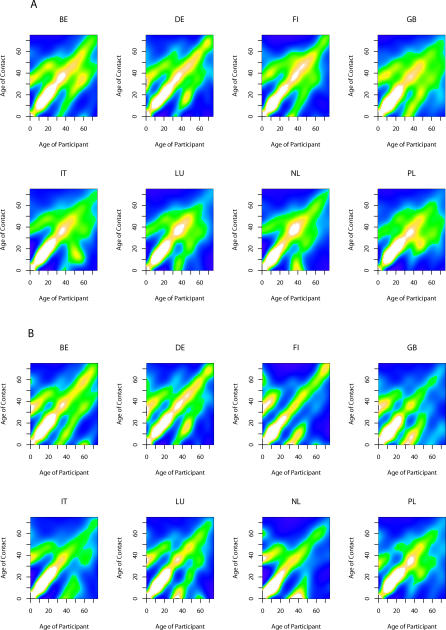
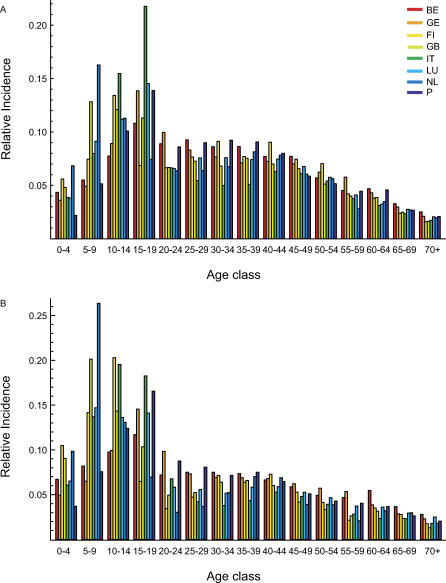
Methods and findings: 7,290 participants recorded characteristics of 97,904 contacts with different individuals during one day, including age, sex, location, duration, frequency, and occurrence of physical contact. We found that mixing patterns and contact characteristics were remarkably similar across different European countries. Contact patterns were highly assortative with age: schoolchildren and young adults in particular tended to mix with people of the same age. Contacts lasting at least one hour or occurring on a daily basis mostly involved physical contact, while short duration and infrequent contacts tended to be nonphysical. Contacts at home, school, or leisure were more likely to be physical than contacts at the workplace or while travelling. Preliminary modelling indicates that 5- to 19-year-olds are expected to suffer the highest incidence during the initial epidemic phase of an emerging infection transmitted through social contacts measured here when the population is completely susceptible.
Conclusions: To our knowledge, our study provides the first large-scale quantitative approach to contact patterns relevant for infections transmitted by the respiratory or close-contact route, and the results should lead to improved parameterisation of mathematical models used to design control strategies.
Conflict of interest statement
Figures
Comment in
-
It's the network, stupid: why everything in medicine is connected.PLoS Med. 2008 Mar 25;5(3):e71. doi: 10.1371/journal.pmed.0050071. PLoS Med. 2008. PMID: 18366249 Free PMC article.
References
-
- Longini IM, Jr., Nizam A, Xu S, Ungchusak K, Hanshaoworakul W, et al. Containing pandemic influenza at the source. Science. 2005;309:1083–1087. - PubMed
Publication types
MeSH terms
LinkOut - more resources
Full Text Sources
Other Literature Sources
