

Density-dependent cladogenesis in birds
- PMID: 18366256
- PMCID: PMC2270327
- DOI: 10.1371/journal.pbio.0060071
Density-dependent cladogenesis in birds
Abstract
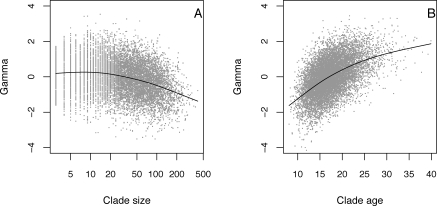
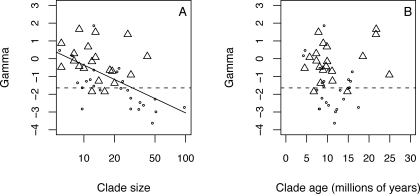
A characteristic signature of adaptive radiation is a slowing of the rate of speciation toward the present. On the basis of molecular phylogenies, studies of single clades have frequently found evidence for a slowdown in diversification rate and have interpreted this as evidence for density dependent speciation. However, we demonstrated via simulation that large clades are expected to show stronger slowdowns than small clades, even if the probability of speciation and extinction remains constant through time. This is a consequence of exponential growth: clades, which, by chance, diversify at above the average rate early in their history, will tend to be large. They will also tend to regress back to the average diversification rate later on, and therefore show a slowdown. We conducted a meta-analysis of the distribution of speciation events through time, focusing on sequence-based phylogenies for 45 clades of birds. Thirteen of the 23 clades (57%) that include more than 20 species show significant slowdowns. The high frequency of slowdowns observed in large clades is even more extreme than expected under a purely stochastic constant-rate model, but is consistent with the adaptive radiation model. Taken together, our data strongly support a model of density-dependent speciation in birds, whereby speciation slows as ecological opportunities and geographical space place limits on clade growth.
Conflict of interest statement
Figures
References
-
- Simpson G. The major features of evolution. New York: Columbia University Press; 1953. 434
-
- Schluter D. The ecology of adaptive radiation. Oxford: Oxford University Press; 2000.
-
- Mayr E. Ecological factors in speciation. Evolution. 1947;1:263–288.
-
- Schluter D. Ecological causes of speciation. In: Howard DJ, Berlocher SH, editors. Endless forms: species and speciation. Oxford: Oxford University Press; 1998. pp. 114–129.
MeSH terms
LinkOut - more resources
Full Text Sources
Other Literature Sources
