. 2008 Mar 26:8:94.
doi: 10.1186/1471-2148-8-94.

Differences in the selection response of serially repeated color pattern characters: standing variation, development, and evolution

Affiliations

Differences in the selection response of serially repeated color pattern characters: standing variation, development, and evolution

Cerisse E Allen et al. BMC Evol Biol. .

Abstract

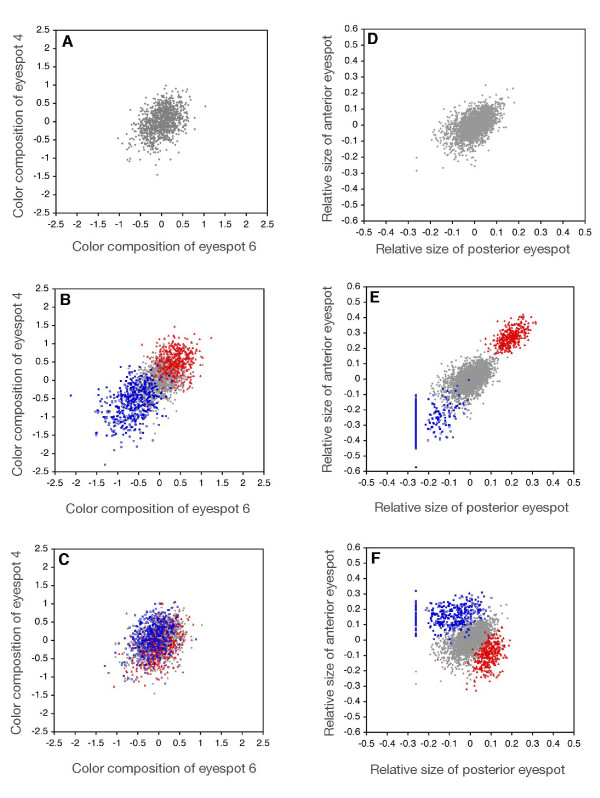
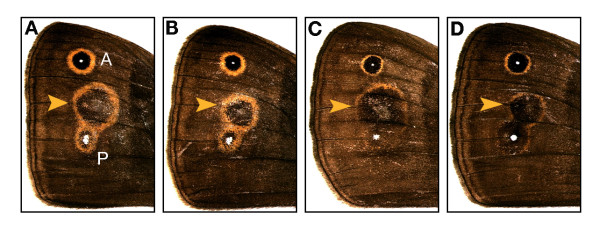
Background: There is spectacular morphological diversity in nature but lineages typically display a limited range of phenotypes. Because developmental processes generate the phenotypic variation that fuels natural selection, they are a likely source of evolutionary biases, facilitating some changes and limiting others. Although shifts in developmental regulation are associated with morphological differences between taxa, it is unclear how underlying mechanisms affect the rate and direction of evolutionary change within populations under selection. Here we focus on two ecologically relevant features of butterfly wing color patterns, eyespot size and color composition, which are similarly and strongly correlated across the serially repeated eyespots. Though these two characters show similar patterns of standing variation and covariation within a population, they differ in key features of their underlying development. We targeted pairs of eyespots with artificial selection for coordinated (concerted selection) versus independent (antagonistic selection) change in their color composition and size and compared evolutionary responses of the two color pattern characters.

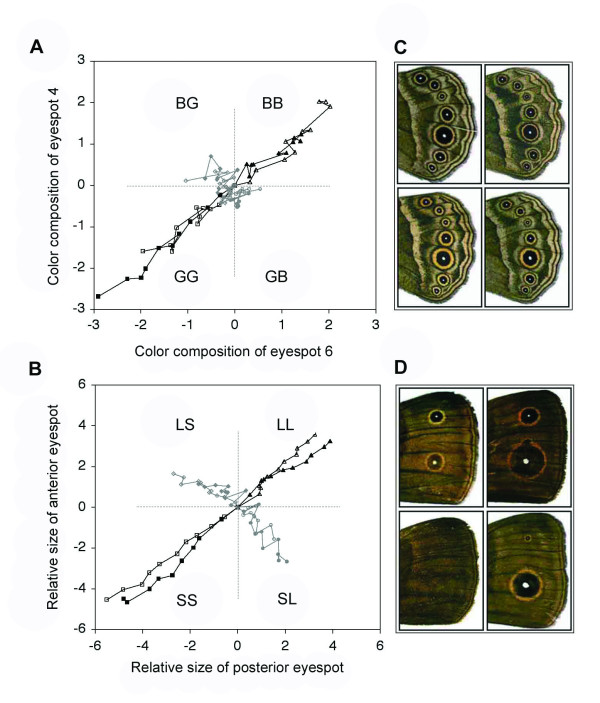
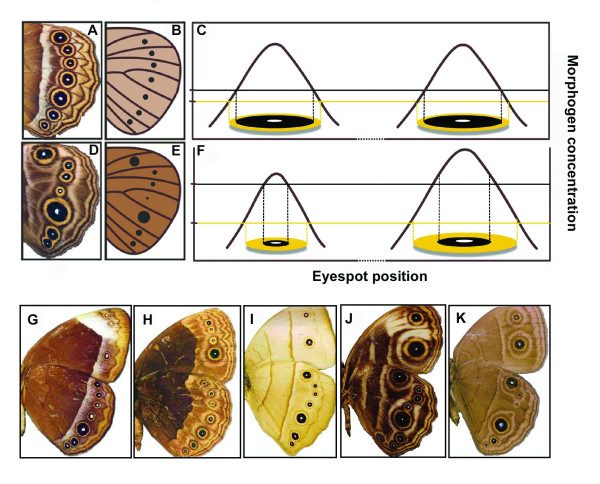
Results: The two characters respond to selection in strikingly different ways despite initially similar patterns of variation in all directions present in the starting population. Size (determined by local properties of a diffusing inductive signal) evolves flexibly in all selected directions. However, color composition (determined by a tissue-level response to the signal concentration gradient) evolves only in the direction of coordinated change. There was no independent evolutionary change in the color composition of two eyespots in response to antagonistic selection. Moreover, these differences in the directions of short-term evolutionary change in eyespot size and color composition within a single species are consistent with the observed wing pattern diversity in the genus.

Conclusion: Both characters respond rapidly to selection for coordinated change, but there are striking differences in their response to selection for antagonistic, independent change across eyespots. While many additional factors may contribute to both short- and long-term evolutionary response, we argue that the compartmentalization of developmental processes can influence the diversification of serial repeats such as butterfly eyespots, even under strong selection.


Figures

Figure 1
Figure 1
Distribution of eyespot phenotypes before and after selection. Bivariate phenotype distributions of eyespot color composition and size before and after artificial selection. A-C, color composition of ventral hindwing eyespots E4 and E6; D-F, size of dorsal forewing anterior and posterior eyespots. In all panels, grey points illustrate phenotype distributions in the starting populations at Generation 0. B and E, distribution of concerted selection lines at Generation 10 relative to Generation 0 (B: 'Black-Black' selected lines in red, 'Gold-Gold' selected lines in blue; E: 'Large-Large' lines in red, 'Small-Small' lines in blue). C and F, distribution of antagonistic selection lines at Generation 10 relative to Generation 0 (C: 'Black-Gold' in blue, 'Gold-Black' in red; F: 'Small-Large' in blue, 'Large-Small' in red). Filled and solid points denote replicates in each selection direction. All data for Generation 10 are shown relative to trait values at Generation 0 (see Materials and Methods for details of trait estimation and selection). Before selection, color composition and size are both positively correlated across pairs of eyespots, but each shows substantial variation in the direction corresponding to antagonistic selection (shown in Figure 2). For Generation 0, N = 1056 for color composition and N = 2254 for size; sample sizes for individual selection lines at Generation 10 ranged from N = 179 to N = 228 (color composition) and from N = 191 to N = 245 (size).
Figure 2
Figure 2
Response to artificial selection for concerted and antagonistic changes in eyespot color composition and size. A and B, Response each generation relative to unselected control values, plotted in phenotypic standard deviations from the starting population mean. Both characters were selected for concerted (black points and lines) and antagonistic (grey) change in two eyespots, filled and solid points represent replicate populations. Lines join points in consecutive generations and mean phenotypes for the starting populations are plotted at the origin. A, Selection for color composition of the fourth and sixth ventral hindwing eyespots (E4 and E6): 'BB' ('Black-Black') and 'GG' ('Gold-Gold') are concerted directions; 'BG' ('Black-Gold') and 'GB' ('Gold-Black') are antagonistic directions. B, Selection for size (relative to wing size) of the anterior and posterior eyespots on the dorsal forewing: 'LL' ('Large-Large') and 'SS' ('Small-Small') are concerted directions; 'LS' ('Large-Small') and 'SL' ('Small-Large') are antagonistic directions. C and D, Representative phenotypes for each selected direction in generation 10 (C, ventral hindwings shown for color composition lines; D, dorsal forewings shown for eyespot size lines; wings arranged according to axes in A and B).
Figure 3
Figure 3
Model for the evolutionary diversification of eyespot size and color composition. A and D, phenotypes representing presumed 'ancestral' and 'derived' eyespot patterns, respectively. B and E, schematics illustrating the strength of the focal signal (size of the black dot) and the level of threshold response (shading of the wing background) for the two phenotypes. In C, eyespot foci at two positions on an 'ancestral' wing surface (x-axis) produce the same amount of a diffusing morphogen (brown curve). The threshold concentration of morphogen inducing black pigment formation (black horizontal line) is higher than the gold-inducing threshold (yellow horizontal line). Size and color composition are the same for both eyespots. In F, eyespot foci on a 'derived' wing surface produce different amounts of the morphogen signal (brown curves) and consequently differ in total size. When the threshold for black pigment production is increased, both eyespots are proportionately 'golder,' since threshold concentration is a property of the whole wing surface. G-K, Bicyclus wing patterns illustrating variation in eyespot color composition (across species, but not within a wing surface) and size (across species and individual eyespots). G, eyespots relatively black (B. analis); H, eyespots relatively gold (B. buea); I-K, clear individualization of eyespot size but not color composition within a wing surface (left to right: B. italus, B. maesseni, B. milyas).
Figure 4
Figure 4
Selection for eyespot color composition affects response properties of the wing epidermis. Ectopic eyespots (arrows) were produced following damage to a non-focal position on the dorsal forewing 17 hours after pupation. Damage induces spatio-temporal patterns of gene expression in the surrounding tissue that mimic the response to diffusing focal signals [94] and results in an ectopic eyespot centered on the damaged site [46], located between the anterior (A) and posterior (P) eyespots. The color composition of ectopic eyespots was significantly different between 'GG' selected lines (A and B) and 'BB' selected lines (C and D; ANCOVA for effect of selection direction: F2,138 = 4.25, P < 0.01; Tukey's HSD: 'GG' vs. 'BB,' t138 = 6.7, Padj < 0.0001). The ectopic eyespots reveal evolutionary changes in the response properties of wing epidermal tissue after concerted selection for color composition. Earlier focal grafting and non-focal damage experiments [51, 53] demonstrate that selection for eyespot size mainly affects properties of the focal signal and the size of ectopic eyespots does not differ between lines selected for large and small eyespots [53, 95].

Similar articles

Cited by

References

    1. Muller GB, Wagner GP. Novelty in Evolution - Restructuring the Concept. Annual Review of Ecology and Systematics. 1991;22:229–256. doi: 10.1146/annurev.es.22.110191.001305. - DOI
    1. Alberch P. Ontogenesis and morphological diversification. American Zoologist. 1980;20(4):653–667.
    1. McGhee GR. The Geometry of Evolution: Adaptive Landscapes and Theoretical Morphospaces. Cambridge , Cambridge University Press; 2007.
    1. Alberch P. Developmental constraints: why St. Bernards often have an extra digit and poodles never do. American Naturalist. 1985;126(3):430–433. doi: 10.1086/284428. - DOI
    1. Blows MW, Hoffmann AA. A reassessment of genetic limits to evolutionary change. Ecology. 2005;86(6):1371–1384. doi: 10.1890/04-1209. - DOI

Publication types

LinkOut - more resources