. 2008 Mar 26:9:164.
doi: 10.1186/1471-2105-9-164.

A comprehensive re-analysis of the Golden Spike data: towards a benchmark for differential expression methods

Affiliations

A comprehensive re-analysis of the Golden Spike data: towards a benchmark for differential expression methods

Richard D Pearson. BMC Bioinformatics. .

Abstract

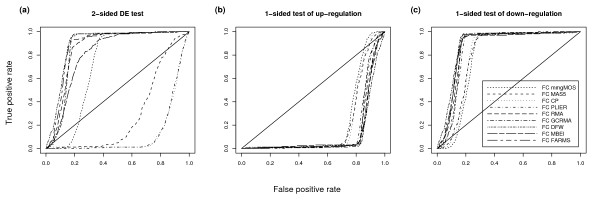
Background: The Golden Spike data set has been used to validate a number of methods for summarizing Affymetrix data sets, sometimes with seemingly contradictory results. Much less use has been made of this data set to evaluate differential expression methods. It has been suggested that this data set should not be used for method comparison due to a number of inherent flaws.

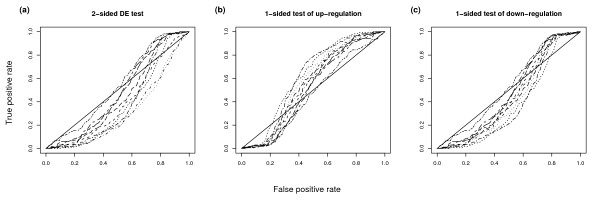
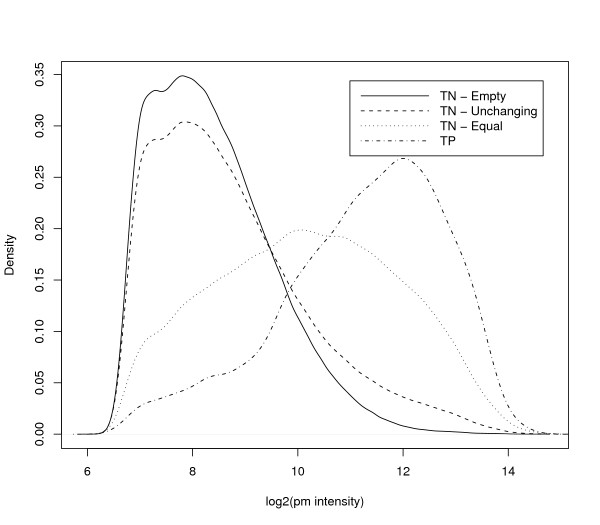
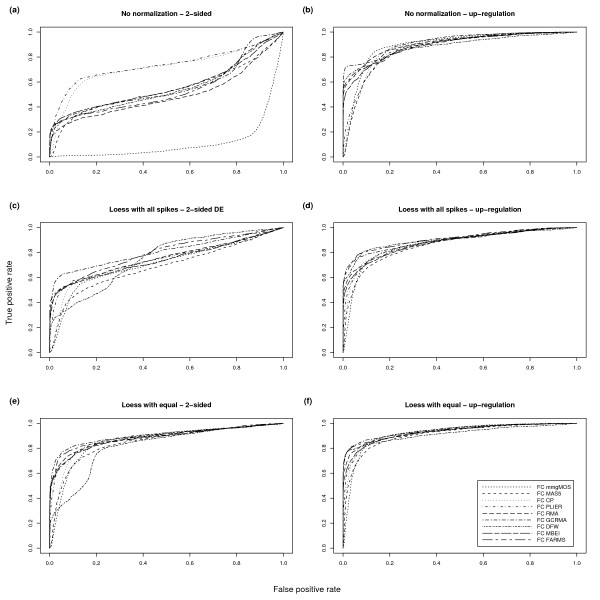
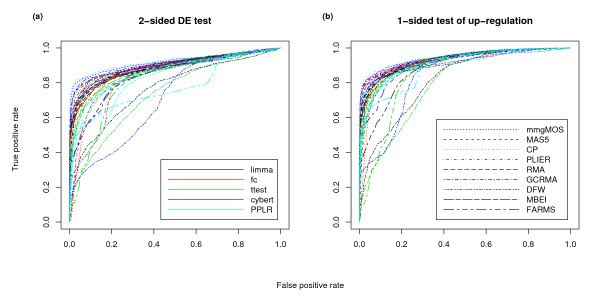
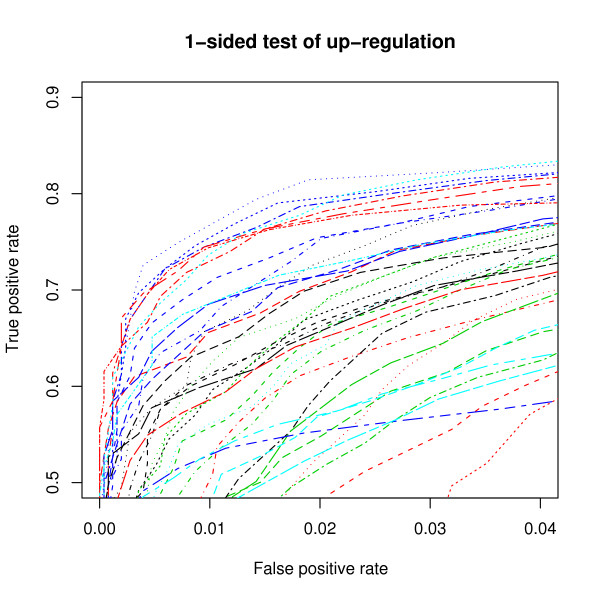
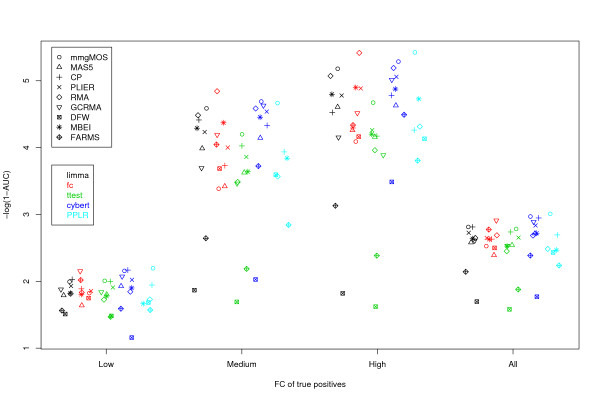
Results: We have used this data set in a comparison of methods which is far more extensive than any previous study. We outline six stages in the analysis pipeline where decisions need to be made, and show how the results of these decisions can lead to the apparently contradictory results previously found. We also show that, while flawed, this data set is still a useful tool for method comparison, particularly for identifying combinations of summarization and differential expression methods that are unlikely to perform well on real data sets. We describe a new benchmark, AffyDEComp, that can be used for such a comparison.

Conclusion: We conclude with recommendations for preferred Affymetrix analysis tools, and for the development of future spike-in data sets.


Figures

Figure 1
Figure 1
Comparison of 1- and 2-sided tests of DE for very low FC genes. ROC charts of Golden Spike data using a 2-sided and two 1-sided tests of DE. For these charts all unchanging probesets are used as true negatives, genes with FC of 1.2 are used as true positives, and no post-summarization normalization is used. We only show results for the FC DE detection method. The different charts show a.) probesets selected using a 2-sided test of DE, b.) probesets selected using a 1-sided test of up-regulation and c.) probesets selected using a 1-sided test of down-regulation. The diagonal line shows the "line of no-discrimination". This shows how well we would expect random guessing of class labels to perform.
Figure 2
Figure 2
Comparison of 1- and 2-sided tests using only equal spike-ins as true negatives. ROC charts of Golden Spike data using a 2-sided and two 1-sided tests of DE, with only the equal spike-ins used as true negatives. Genes with FC of 1.2 are used as true positives, and no post-summarization normalization is used. We only show results for the FC DE detection method. The legend is the same as in Figure 1. The different charts show a.) probesets selected using a 2-sided test of DE, b.) probesets selected using a 1-sided test of up-regulation and c.) probesets selected using a 1-sided test of down-regulation. As with Figure 1, we include lines of no-discrimination.
Figure 3
Figure 3
Density plots of intensities for different choices of true negatives. These plots show the distributions of intensities of perfect match (PM) probes across all six arrays of the Golden Spike data, for different subsets of probesets. We show plots for three potential choices of true negative (TN) probesets: the Empty probesets are defined as those for which there is no corresponding spike-in RNAs. The Equal probesets are defined as those spiked in at equal concentrations in the C and S conditions. The Unchanging probesets are defined as the set of all Empty and Equal probesets. For this chart we have defined true positives (TP) as those probesets which have been spiked in at higher concentration in the S condition relative to the C condition.
Figure 4
Figure 4
Comparison of different post-summarization normalization strategies. ROC charts of Golden Spike data using a 2-sided and a 1-sided test of DE, and using three different post-summarization normalization strategies. For these charts only the equal spike-ins are used as true negatives, and all spike-ins with FC > 1 are used as true positives. We only show results for the FC DE detection method. The top row relates to data sets created without any post-summarization normalization. The middle row relates to data sets created using all probesets for the loess normalization. The bottom row relates to data sets created using only the equal spike-in probesets for the loess normalization. The left column shows probesets selected using a 2-sided test of DE. The right column shows probesets selected using a 1-sided test of up-regulation.
Figure 5
Figure 5
Comparison of combinations of summarization/DE detection methods. ROC charts of Golden Spike data using a 2-sided and a 1-sided test of DE, using different combinations of summarization and DE detection methods. For these charts only the equal spike-ins are used as true negatives, and all spike-ins with FC > 1 are used as true positives. A post-summarization loess normalization based on the equal-valued spike-ins was used. The different charts show a.) probesets selected using a 2-sided test of DE, and b.) probesets selected using a 1-sided test of up-regulation. The two legends refer to both a.) and b.)
Figure 6
Figure 6
Comparison of combinations of summarization/DE detection methods at low false positive rates. ROC charts of Golden Spike data using a 1-sided test of DE, using different combinations of summarization and DE detection methods, and showing only false positive rates between 0 and 0.04, and false negative rates between 0.5 and 0.9. For these charts only the equal spike-ins are used as true negatives, and all spike-ins with FC > 1 are used as true positives. A post-summarization loess normalization based on the equal-valued spike-ins was used. The legend is the same as in Figure 5.
Figure 7
Figure 7
Comparison of different choices of true positives. Areas under ROC curves of Golden Spike data using different combinations of summarization and DE detection methods, and different sets of true positives. For these charts only the equal spike-ins are used as true negatives. The chart shows probesets selected using a 1-sided test of up-regulation. The Low true positives are those spike-ins with a FC greater than 1 but less than or equal to 1.7. The Medium true positives are those spike-ins with a FC between 2 and 2.5 inclusive. The High true positives are those spike-ins with a FC greater than or equal to 3. The y-axis shows -log(1-AUC) rather than AUC, as this gives a better separation between the higher AUC values, but retains the same rank order of methods. The x-axis is categorical, with points jittered to avoid placement on top of each other.

References

    1. Allison DB, Cui X, Page GP, Sabripour M. Microarray data analysis: from disarray to consolidation and consensus. Nat Rev Genet. 2006;7:55–65. doi: 10.1038/nrg1749. - DOI - PubMed
    1. Cope LM, Irizarry RA, Jaffee HA, Wu Z, Speed TP. A benchmark for Affymetrix GeneChip expression measures. Bioinformatics. 2004;20:323–31. doi: 10.1093/bioinformatics/btg410. - DOI - PubMed
    1. Shi L, Reid LH, Jones WD, Shippy R, Warrington JA, Baker SC, Collins PJ, de Longueville F, Kawasaki ES, Lee KY, et al. The MicroArray Quality Control (MAQC) project shows inter- and intraplatform reproducibility of gene expression measurements. Nat Biotechnol. 2006;24:1151–61. doi: 10.1038/nbt1239. - DOI - PMC - PubMed
    1. Choe SE, Boutros M, Michelson AM, Church GM, Halfon MS. Preferred analysis methods for Affymetrix GeneChips revealed by a wholly defined control dataset. Genome Biol. 2005;6:R16. doi: 10.1186/gb-2005-6-2-r16. - DOI - PMC - PubMed
    1. Dabney AR, Storey JD. A reanalysis of a published Affymetrix GeneChip control dataset. Genome Biol. 2006;7:401. doi: 10.1186/gb-2006-7-3-401. - DOI - PMC - PubMed

Publication types

MeSH terms

LinkOut - more resources