

The crucial role of chromogranins in storage and exocytosis revealed using chromaffin cells from chromogranin A null mouse
- PMID: 18367602
- PMCID: PMC6670582
- DOI: 10.1523/JNEUROSCI.5292-07.2008
The crucial role of chromogranins in storage and exocytosis revealed using chromaffin cells from chromogranin A null mouse
Abstract
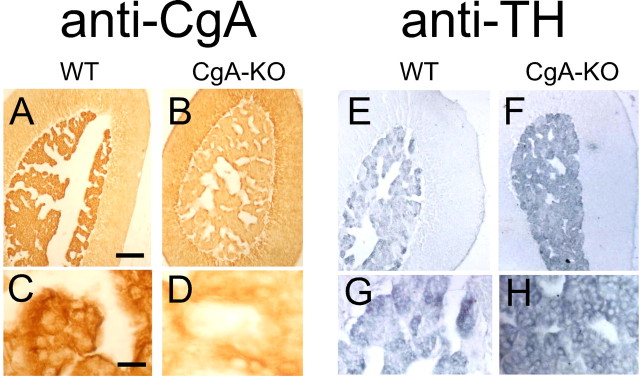
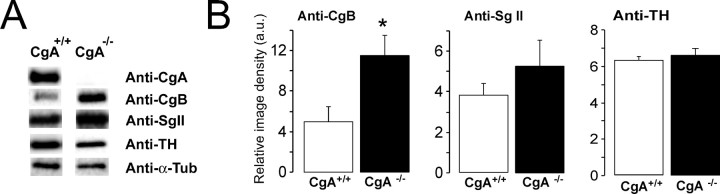
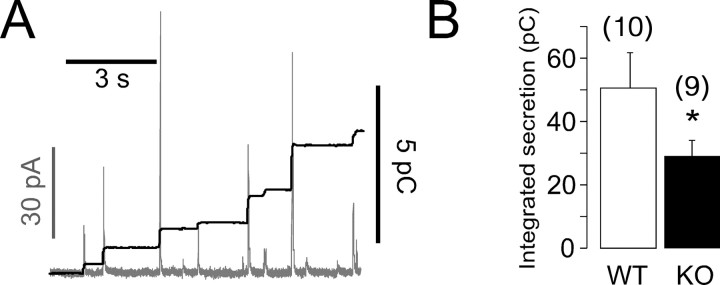
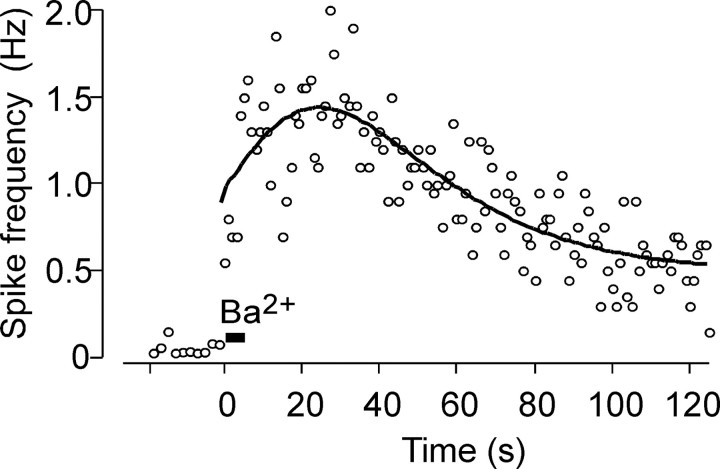
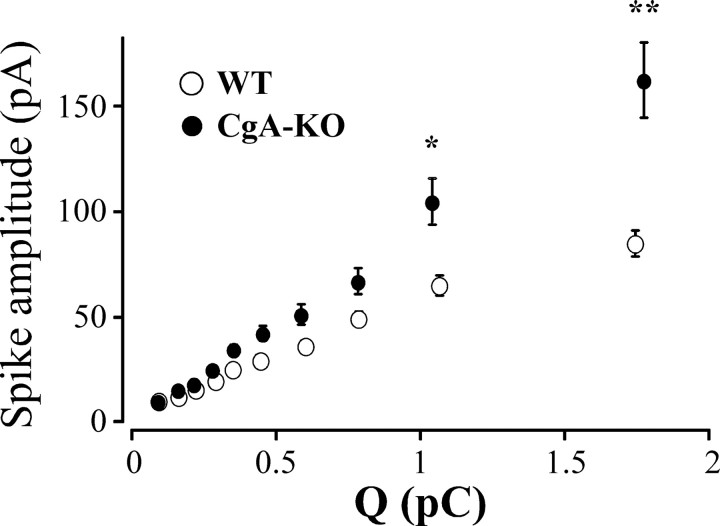
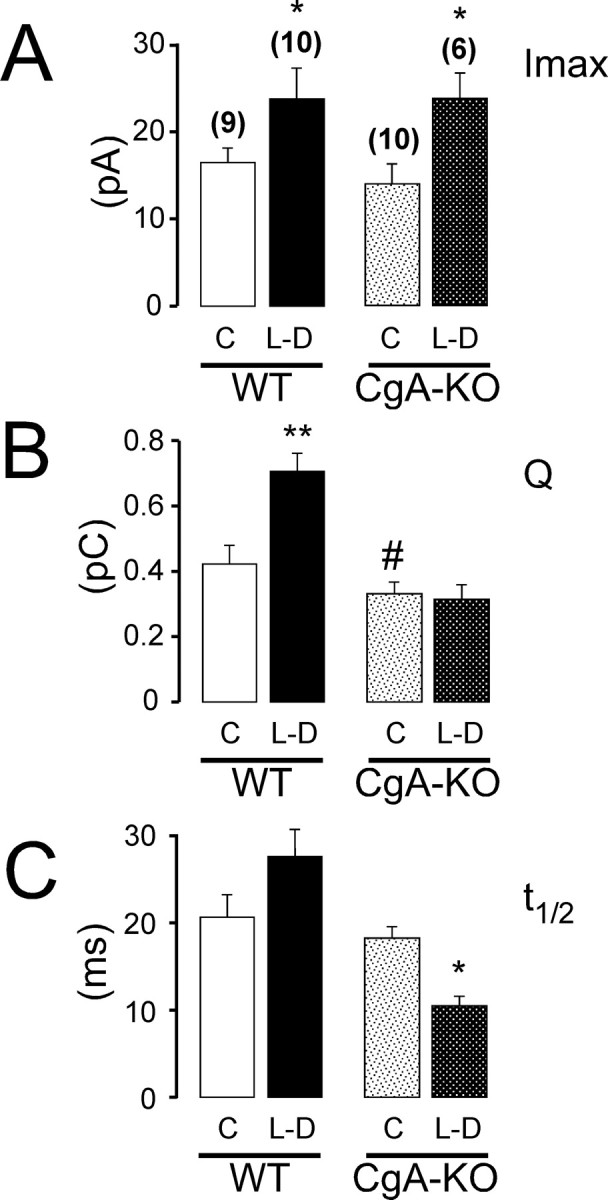
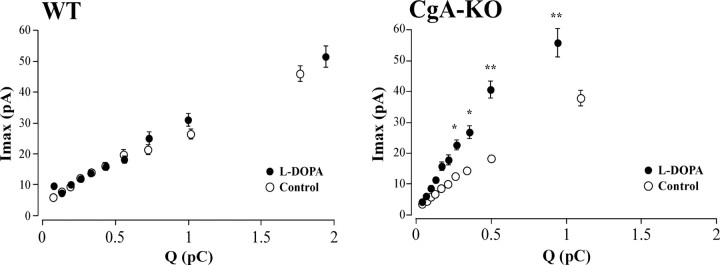
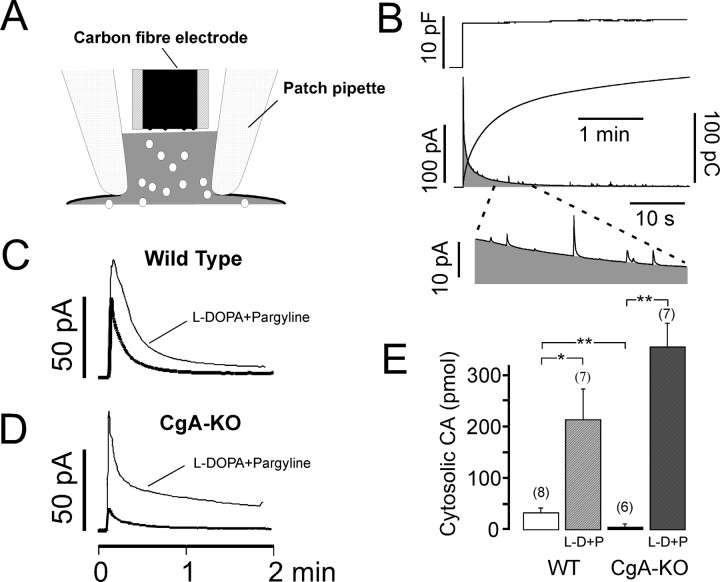
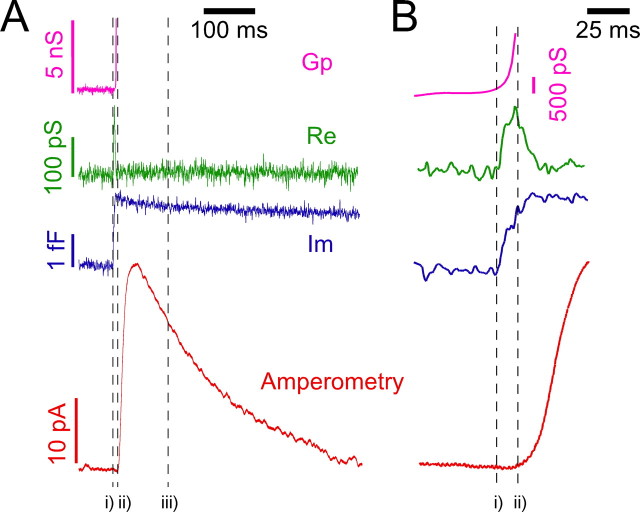
Chromogranins (Cgs) are the major soluble proteins of dense-core secretory vesicles. Chromaffin cells from Chga null mice [chromogranin A knock-out (CgA-KO)] exhibited approximately 30% reduction in the content and in the release of catecholamines compared with wild type. This was because of a lower secretion per single exocytotic event, rather than to a lower frequency of exocytotic events. Cell incubation with L-DOPA produced an increase in the vesicular amine content of wild-type, but not CgA-KO vesicles. In contrast, intracellular electrochemistry showed that L-DOPA produced a significantly larger increase in cytosolic amines in CgA-KO cells than in the wild type. These data indicate that the mechanisms for vesicular accumulation in CgA-KO cells were fully saturated. Patch-amperometry recordings showed a delayed initiation of the amperometric signal after vesicle fusion, whereas no changes were observed in vesicle size or fusion pore kinetics despite the smaller amine content. We conclude that intravesicular proteins are highly efficient systems directly implicated in transmitter accumulation and in the control of neurosecretion.
Figures
Similar articles
-
Chromogranin B gene ablation reduces the catecholamine cargo and decelerates exocytosis in chromaffin secretory vesicles.J Neurosci. 2010 Jan 20;30(3):950-7. doi: 10.1523/JNEUROSCI.2894-09.2010. J Neurosci. 2010. PMID: 20089903 Free PMC article.
-
Chromogranins A and B are key proteins in amine accumulation, but the catecholamine secretory pathway is conserved without them.FASEB J. 2012 Jan;26(1):430-8. doi: 10.1096/fj.11-181941. Epub 2011 Oct 11. FASEB J. 2012. PMID: 21990378
-
The functional role of chromogranins in exocytosis.J Mol Neurosci. 2012 Oct;48(2):317-22. doi: 10.1007/s12031-012-9736-2. Epub 2012 Mar 14. J Mol Neurosci. 2012. PMID: 22415354
-
Chromogranins as regulators of exocytosis.J Neurochem. 2010 Jul;114(2):335-43. doi: 10.1111/j.1471-4159.2010.06786.x. Epub 2010 Apr 29. J Neurochem. 2010. PMID: 20456013 Review.
-
The role of chromogranins in the secretory pathway.Biomol Concepts. 2013 Dec;4(6):605-9. doi: 10.1515/bmc-2013-0020. Biomol Concepts. 2013. PMID: 25436760 Review.
Cited by
-
Fusion Pore Expansion and Contraction during Catecholamine Release from Endocrine Cells.Biophys J. 2020 Jul 7;119(1):219-231. doi: 10.1016/j.bpj.2020.06.001. Epub 2020 Jun 8. Biophys J. 2020. PMID: 32562620 Free PMC article.
-
Pro-hormone secretogranin II regulates dense core secretory granule biogenesis in catecholaminergic cells.J Biol Chem. 2010 Mar 26;285(13):10030-10043. doi: 10.1074/jbc.M109.064196. Epub 2010 Jan 8. J Biol Chem. 2010. PMID: 20061385 Free PMC article.
-
Old and emerging concepts on adrenal chromaffin cell stimulus-secretion coupling.Pflugers Arch. 2018 Jan;470(1):1-6. doi: 10.1007/s00424-017-2082-z. Epub 2017 Nov 6. Pflugers Arch. 2018. PMID: 29110079
-
Vesicle fusion and release in neurons under dynamic mechanical equilibrium.iScience. 2024 Apr 19;27(5):109793. doi: 10.1016/j.isci.2024.109793. eCollection 2024 May 17. iScience. 2024. PMID: 38736547 Free PMC article. Review.
-
Single cell amperometry reveals glycocalyx hinders the release of neurotransmitters during exocytosis.Anal Chem. 2013 May 7;85(9):4822-8. doi: 10.1021/ac4008682. Epub 2013 Apr 11. Anal Chem. 2013. PMID: 23544960 Free PMC article.
References
-
- Albillos A, Dernick G, Horstmann H, Almers W, Alvarez de Toledo G, Lindau M. The exocytotic event in chromaffin cells revealed by patch amperometry. Nature. 1997;389:509–512. - PubMed
-
- Berneis KH, Goetz U, Da Prada M, Pletscher A. Interaction of aggregated catecholamines and nucleotides with intragranular proteins. Naunyn Schmiedebergs Arch Pharmacol. 1973;277:291–296. - PubMed
-
- Borges R, Sala F, Garcia AG. Continuous monitoring of catecholamine release from perfused cat adrenals. J Neurosci Methods. 1986;16:289–300. - PubMed
-
- Borges R, Travis ER, Hochstetler SE, Wightman RM. Effects of external osmotic pressure on vesicular secretion from bovine adrenal medullary cells. J Biol Chem. 1997;272:8325–8331. - PubMed
-
- Borges R, Machado JD, Alonso C, Brioso MA, Gomez JF. Functional role of chromogranins. The intragranular matrix in the last phase of exocytosis. Adv Exp Med Biol. 2000;482:69–81. - PubMed
Publication types
MeSH terms
Substances
LinkOut - more resources
Full Text Sources
Molecular Biology Databases
Research Materials
Miscellaneous