. 2008 Mar 26;28(13):3415-26.
doi: 10.1523/JNEUROSCI.2743-07.2008.

Level invariant representation of sounds by populations of neurons in primary auditory cortex

Affiliations

Level invariant representation of sounds by populations of neurons in primary auditory cortex

Srivatsun Sadagopan et al. J Neurosci. .

Abstract

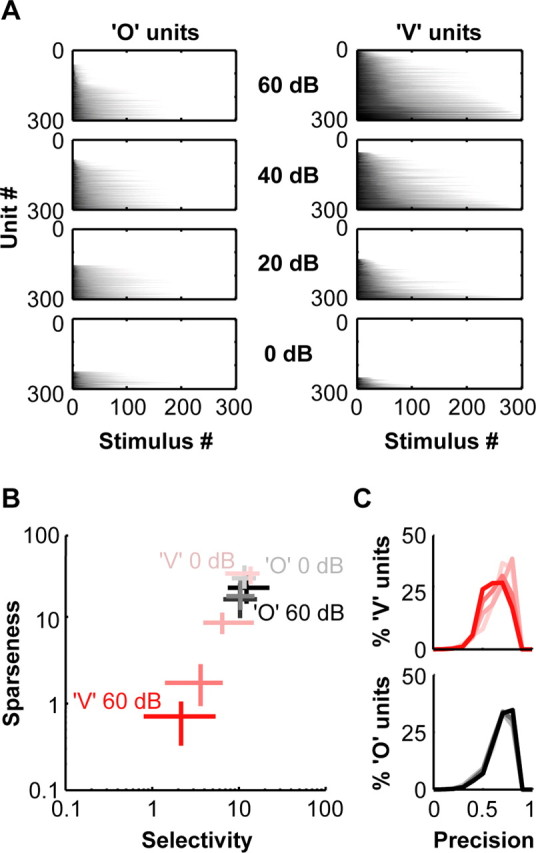
A fundamental feature of auditory perception is the constancy of sound recognition over a large range of intensities. Although this invariance has been described in behavioral studies, the underlying neural mechanism is essentially unknown. Here we show a putative level-invariant representation of sounds by populations of neurons in primary auditory cortex (A1) that may provide a neural basis for the behavioral observations. Previous studies reported that pure-tone frequency tuning of most A1 neurons widens with increasing sound level. In sharp contrast, we found that a large proportion of neurons in A1 of awake marmosets were narrowly and separably tuned to both frequency and sound level. Tuning characteristics and firing rates of the neural population were preserved across all tested sound levels. These response properties lead to a level-invariant representation of sounds over the population of A1 neurons. Such a representation is an important step for robust feature recognition in natural environments.


Figures

Figure 1.
Figure 1.
A1 FRA shapes. Frequency tuning curves (white lines) were computed at different levels, and area-matched rectangles (black boxes) were fit to them to determine bandwidth at each level and used to compute an SI. Blue lines on margins are “slices” of the FRA and denote frequency tuning at best level (top) and level tuning at best frequency (right). These were later used to determine separability of the FRA. A–D, Based on FRA shape, neurons were classified as V (A), I (B), and O (C, D) units (color map corresponds to normalized response rate). Corresponding spike rasters show stimulus-dependent temporal dynamics of the response (shaded area is stimulus duration; black dots are spikes falling inside our analysis window). Stimuli are ordered in blocks of increasing tone frequency. Within each frequency block, sound level is varied (gray box in C corresponds to a single frequency bin, expanded in inset).
Figure 2.
Figure 2.
Distinct response types to pure-tone stimuli. A, The distribution of SIs computed from the FRAs of 275 tone-responsive A1 units was bimodal. We used SI of 0.75 as a boundary to separate O (black; n = 175) from I and V (gray; n = 100) units. B, Distributions of separability (r2) computed for O and I/V units. The majority of O units were separable into frequency and level tuning components. C, Distribution of best sound levels separated by unit type. O units covered lower sound levels, whereas most I/V units preferred high sound levels with a few exceptions. D, MI was strongly correlated with FRA shape. Most O units were strongly nonmonotonic (MI of 0.25), and most V units had monotonic rate-level functions (MI of 1). E, No significant difference was observed between the BF distributions of O and I/V units. F, Q values calculated at best level show that O units are much more sharply tuned than I/V units. All values are medians; **p < 0.01, statistical significance determined with Wilcoxon's rank-sum tests for equal medians.
Figure 3.
Figure 3.
Temporal dynamics of O and I/V unit tuning properties. A, O and I/V units encode frequency-level space differently (distributions are on margins). O units were finely tuned in both frequency (0.25 octaves) and level (25 dB), whereas I/V units were broadly tuned to frequency (0.52 octaves) and responded to a broader range of levels (32 dB). B, Distribution of SI difference between the onset (first 50 ms) and sustained (next 100 ms) of the response. O units retain shape throughout response duration, whereas V units show decreased SI during the sustained response window, indicating sharpening of the FRA. C, When the onset (on, first 50 ms) and sustained (sus, next 100 ms) portions of the response were analyzed separately (medians and interquartile range are plotted), the bandwidth and level tuning width of I/V units dropped by 25 and 30%, respectively, and approached the resolution of the O units as the response developed over time. O units, conversely, retained the same resolution over the entire response duration. All values are medians; **p < 0.01, statistical significance determined with Wilcoxon's rank-sum tests for equal medians.
Figure 4.
Figure 4.
Invariance of O unit tuning properties with level. A, Comparison of I/V and O unit coverage of the frequency and level axes. Lines (top) correspond to receptive field extents of randomly selected I/V units at half-maximal firing rate. This represents a traditional view of auditory cortex in which stimulus amplitude is represented by units with different thresholds. Frequency resolution decreases with increasing level. Ellipses (bottom) correspond to O unit receptive fields at half-maximal firing rate. This representation of stimulus space is different from the traditional view, in which amplitude in each frequency range is encoded by multiple units tuned to a smaller range of levels and frequency tuning width is independent of level (colors of lines and ellipses correspond to best frequency for clarity). B, The dependence of frequency tuning on level in I/V units leads to confusion in the readout. Frequency tuning curves are plotted for an example low-threshold V unit at different levels (lines of increasing saturation correspond to tuning curves at increasing levels). At maximum firing rate (dashed blue lines), there is only one possible readout, but when the firing rate changes to a half-maximal level (dashed cyan lines), a number of possibilities covering a frequency range of ∼1 octave and an amplitude range of ∼80 dB must be resolved. C, In the O unit population, however, this readout is much simpler. Even for an O unit responding over a 40 dB range, the number of possibilities at half-maximal rate and the spread of possible parameter values are restricted. D, E, Population summary of the invariance of tuning properties of O units with level. Regardless of best sound level, O units were narrowly tuned in frequency and level. F, The maximum firing rate of O units in response to pure tones also did not change with sound level. (**p < 0.01, Wilcoxon's rank-sum test).
Figure 5.
Figure 5.
Effect of a continuous noise masker on O units. A, When continuous masker noise (dashed line; masker level of 10 dB) was added while presenting tones to an O unit, the best level of that unit shifted while maintaining frequency and level tuning. B, Over the population of strongly nonmonotonic units (black histogram; n = 73 comparisons from 26 neurons, 2–3 masker levels per neuron), we observed a 50% shift in best level. However, because of our low sampling resolution, it is unclear whether shifts occurred at low masker levels (cyan; n = 22). When these data are plotted for maskers at or louder than the best level of the unit (red; n = 51), the observed shift was higher (67%). This implies that the same units continue to encode sounds when there are dynamic shifts in noise conditions without altering their tuning properties (**p < 0.01, Wilcoxon's rank-sum test).
Figure 6.
Figure 6.
Level tuning typically generalized to more complex stimuli. A, Two example units whose level tuning curves were similar for pure-tone and lFM stimuli. B, Correlation of level tuning parameters (best level, level tuning width, and monotonicity index) derived using pure-tone and lFM stimuli measured from 13 single units. C, In a few units tested, best level shifts attributable to the addition of wideband noise masker also occurred for lFM stimuli with magnitudes similar to pure-tone stimuli.
Figure 7.
Figure 7.
Conceptual model of a level-invariant representation in A1. A, Diagram of a cortical sheet of neurons responding to a pure tone. Gray circles represent individual neurons, ordered by best frequency and best level, and grayscale fill represents response rate. When a pure tone (at 5 kHz, for example) is presented at a low level (0 dB; left), only O units tuned to low levels and low-threshold V units respond. In both cases, because of narrow frequency tuning, spread of activity is restricted to a small number of neurons. When sound level is increased (80 dB; right), O units tuned to this level start responding but the units tuned to low levels stop firing. The pattern of activity generated is just as restricted as low sound levels. However, activity spreads over a range of V units coding different frequencies and sound levels, leading to a loss of spectral resolution. B, If a linear frequency modulated sweep (gray bar indicates spectral extent of sweep; small black arrows indicate instantaneous frequency of sweep) is presented as the stimulus at low levels (0 dB; left), a tight packet of activity propagates with the sweep across the cortical surface (snapshots of the population at 50 and 100 ms into the sweep are shown). When level is increased (80 dB; right), activity packets are just as well resolved in the O unit population. In the V unit population, there is temporal and spectral degradation. The neuron highlighted in black, for example, is active over a duration of 50 ms, starting to fire before the sweep “reaches” its BF (computed at threshold) and firing well after the sweep has crossed its BF. C, Temporal precision of response is also affected by bandwidth. When an lFM sweep (black line) crosses the excitatory receptive field (shaded gray) of a narrowly tuned unit (bottom), response duration (double arrow) is short. However, for broadly tuned units (top), response is smeared out over time.
Figure 8.
Figure 8.
Model O and V units and their responses to common stimuli. A, FRAs of O and V units that were modeled as spectrally linear integrators with difference of Gaussian-shaped receptive fields with response parameters drawn from our experimental data. B, Model O and V unit responses to commonly used stimuli. Both types of model units were responsive to pure tones, bandpass noise (with bandwidth limited to the excitatory part of their receptive fields), and marmoset twitter calls. Neither class responded to wideband noise.
Figure 9.
Figure 9.
Simulation of O and V unit responses to test population level invariance. A, Normalized responses of 300 O (left) or V (right) units to a battery of 300 complex stimuli at multiple levels. Units are sorted by selectivity and stimuli are sorted by efficacy (gray shading indicates response strength) for display clarity. Whereas similar numbers of O units responded to similar numbers of stimuli at al levels, more V units became active in response to more stimuli as level increased. B, Indicators of population activity remained constant with level in the simulated O unit population but degraded in the V unit population. Selectivity and sparseness (lines are interquartile range, and intersection points are medians) of the O unit population (gray lines; black, 60 dB; lightest gray, 0 dB) remained constant, with sound level indicating level invariance of the population. The V unit population (red lines; red, 60 dB; lightest pink, 0 dB) resembled the O unit population at a low level (0 dB) but gradually lost selectivity and sparseness with increasing sound level. C, This model predicts decreasing precision of V unit responses with increasing sound level as a consequence of increasing bandwidth, whereas precision of O unit responses remain constant with level.

Similar articles

Cited by

References

    1. Agamaite JA. Johns Hopkins University; 1997. A quantitative characterization of the vocal repertoire of the common marmoset. Master's thesis.
    1. Barbour DL, Wang X. Auditory cortical responses elicited in awake primates by random spectral stimuli. J Neurosci. 2003;23:7194–7206. - PMC - PubMed
    1. Brincat SL, Connor CE. Dynamic shape synthesis in posterior inferotemporal cortex. Neuron. 2006;49:17–24. - PubMed
    1. Brugge JF, Merzenich MM. Responses of neurons in auditory cortex of the macaque monkey to monaural and binaural stimulation. J Neurophysiol. 1973;36:1138–1158. - PubMed
    1. Calford MB, Webster WR, Semple MM. Measurement of frequency selectivity of single neurons in the central auditory pathway. Hear Res. 1983;11:395–401. - PubMed

Publication types

LinkOut - more resources