

Structural mechanisms underlying benzodiazepine modulation of the GABA(A) receptor
- PMID: 18367615
- PMCID: PMC2410040
- DOI: 10.1523/JNEUROSCI.5727-07.2008
Structural mechanisms underlying benzodiazepine modulation of the GABA(A) receptor
Abstract
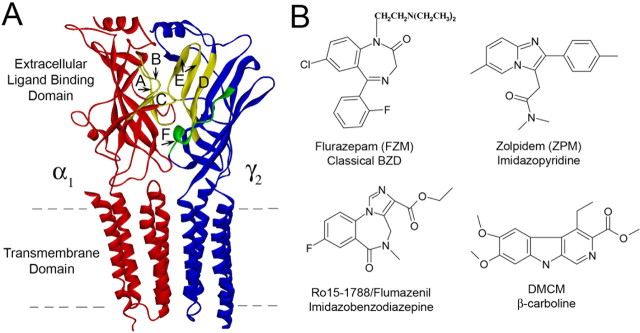
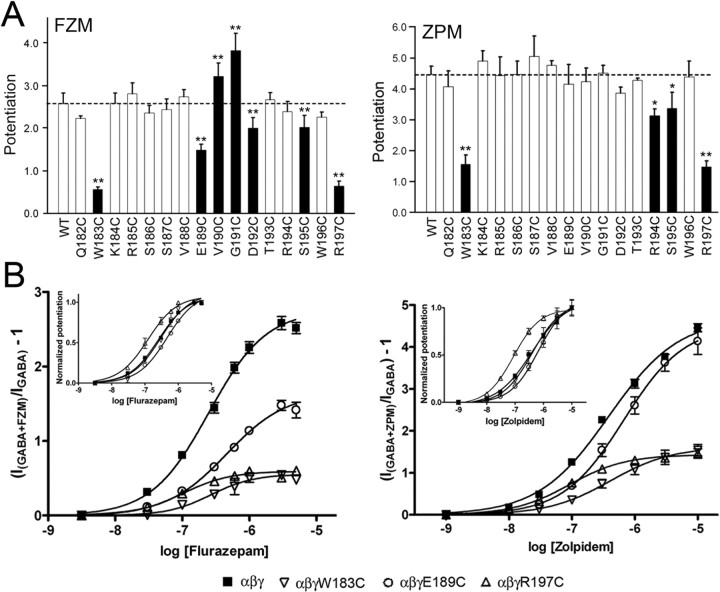
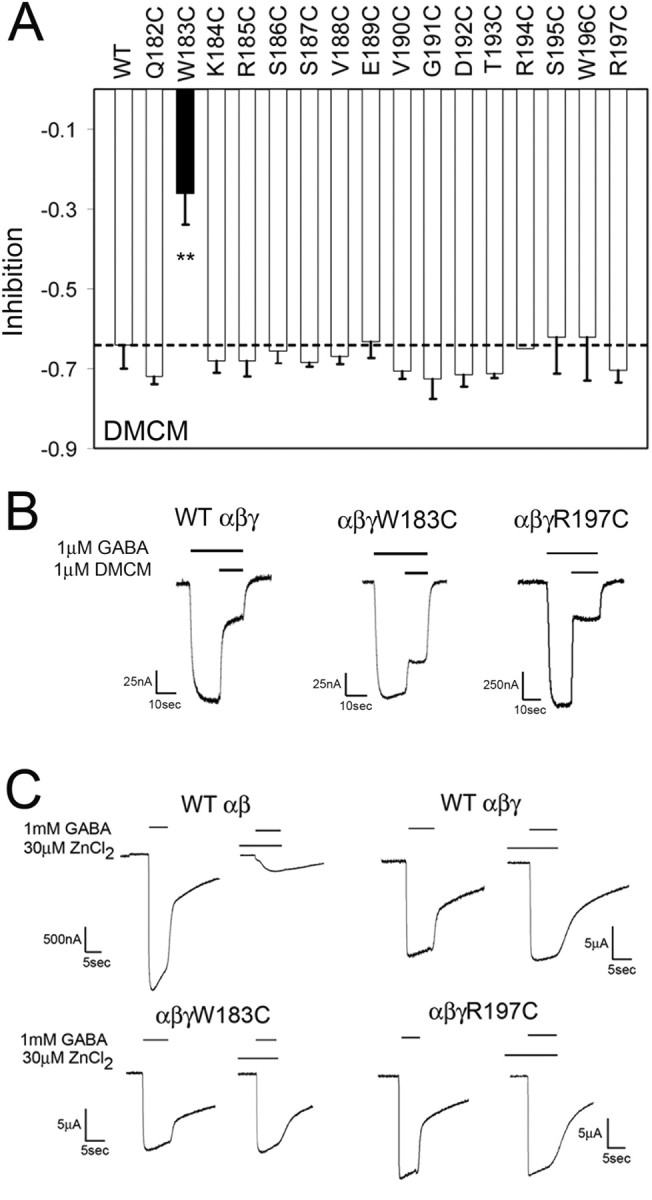
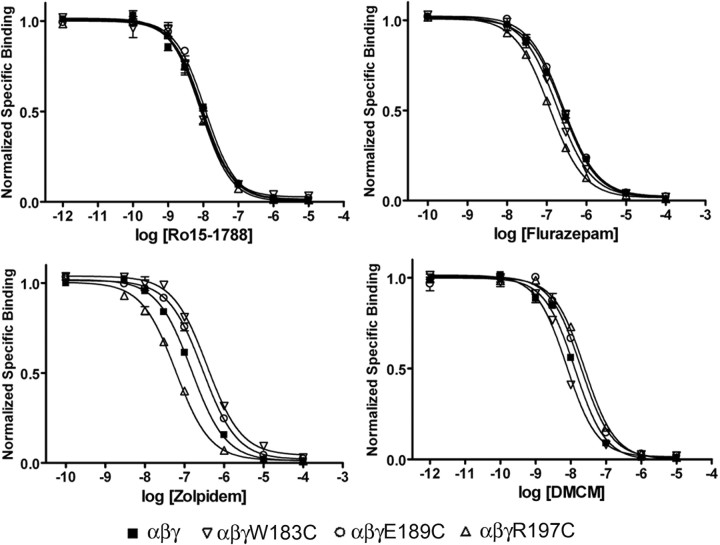
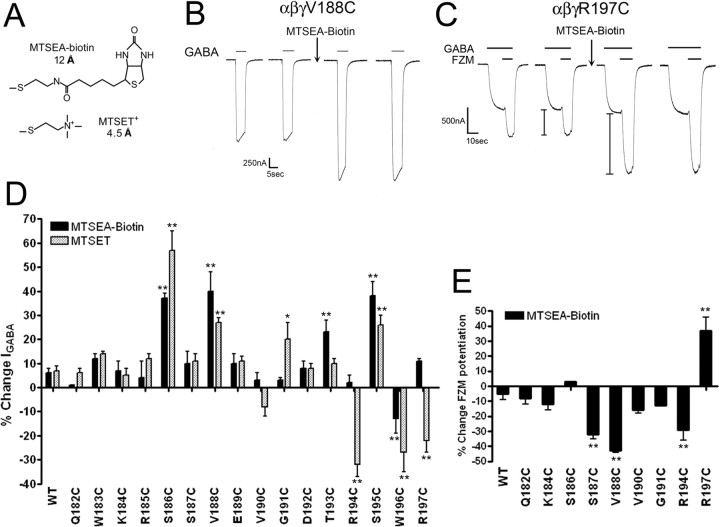
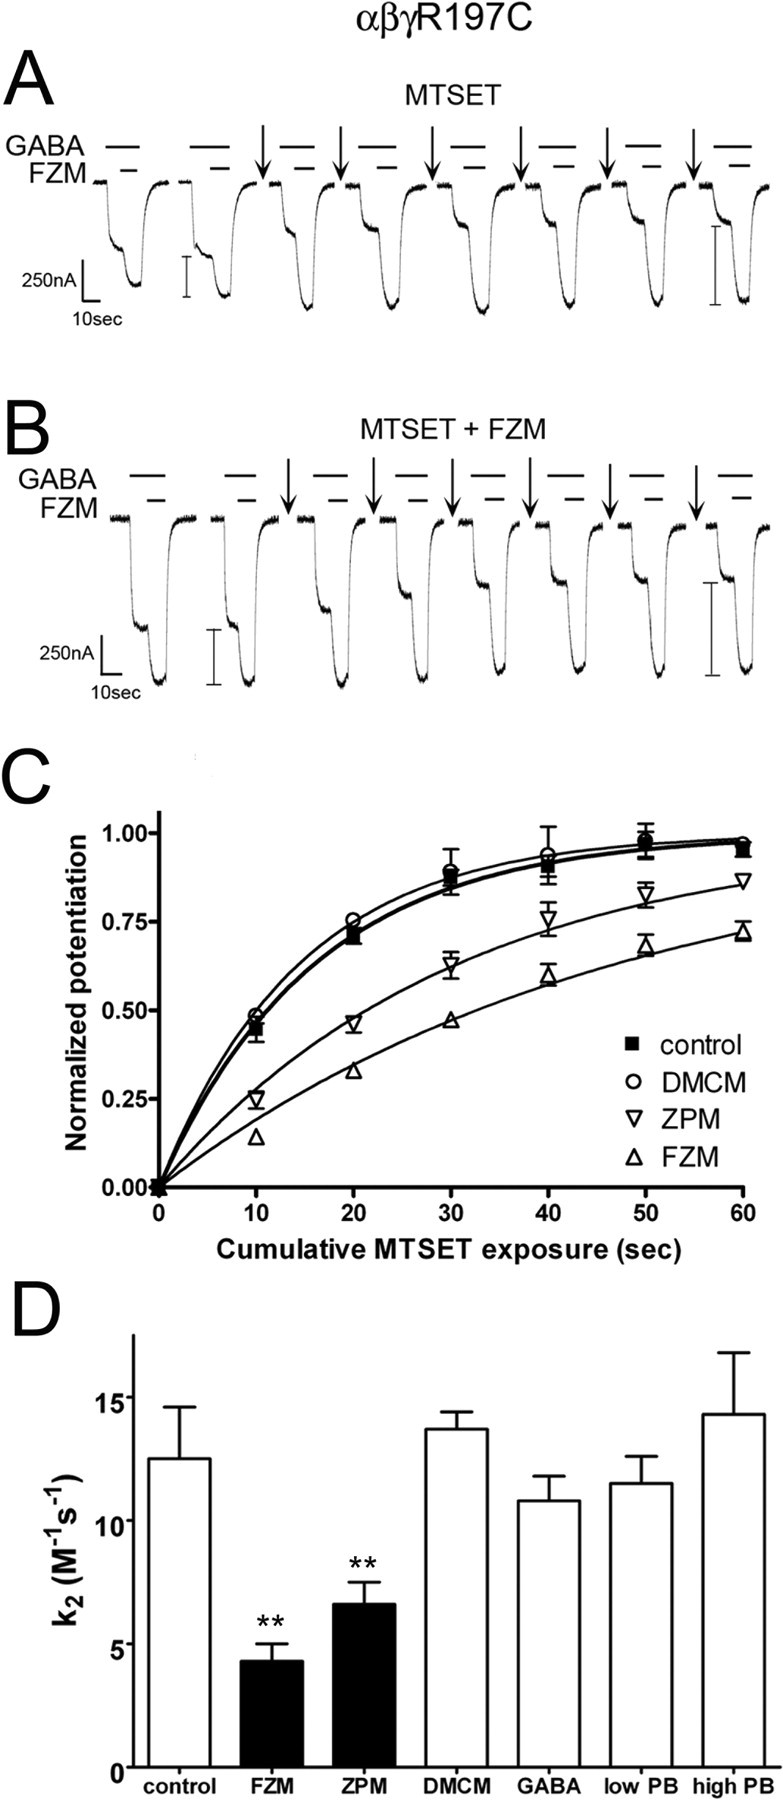
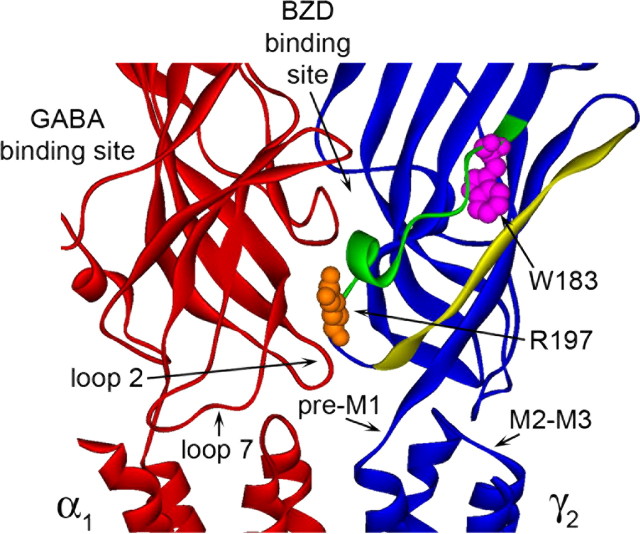
Many clinically important drugs target ligand-gated ion channels; however, the mechanisms by which these drugs modulate channel function remain elusive. Benzodiazepines (BZDs), anesthetics, and barbiturates exert their CNS actions by binding to GABA(A) receptors and modulating their function. The structural mechanisms by which BZD binding is transduced to potentiation or inhibition of GABA-induced current (I(GABA)) are essentially unknown. Here, we explored the role of the gamma(2)Q182-R197 region (Loop F/9) in the modulation of I(GABA) by positive (flurazepam, zolpidem) and negative [3-carbomethoxy-4-ethyl-6,7-dimethoxy-beta-carboline (DMCM)] BZD ligands. Each residue was individually mutated to cysteine, coexpressed with wild-type alpha(1) and beta(2) subunits in Xenopus oocytes, and analyzed using two-electrode voltage clamp. Individual mutations differentially affected BZD modulation of I(GABA). Mutations affecting positive modulation span the length of this region, whereas gamma(2)W183C at the beginning of Loop F was the only mutation that adversely affected DMCM inhibition. Radioligand binding experiments demonstrate that mutations in this region do not alter BZD binding, indicating that the observed changes in modulation result from changes in BZD efficacy. Flurazepam and zolpidem significantly slowed covalent modification of gamma(2)R197C, whereas DMCM, GABA, and the allosteric modulator pentobarbital had no effects, demonstrating that gamma(2)Loop F is a specific transducer of positive BZD modulator binding. Therefore, gamma(2)Loop F plays a key role in defining BZD efficacy and is part of the allosteric pathway allowing positive BZD modulator-induced structural changes at the BZD binding site to propagate through the protein to the channel domain.
Figures
Similar articles
-
A (beta)-strand in the (gamma)2 subunit lines the benzodiazepine binding site of the GABA A receptor: structural rearrangements detected during channel gating.J Neurosci. 2001 Jul 15;21(14):4977-86. doi: 10.1523/JNEUROSCI.21-14-04977.2001. J Neurosci. 2001. PMID: 11438573 Free PMC article.
-
Allosteric modulators induce distinct movements at the GABA-binding site interface of the GABA-A receptor.Neuropharmacology. 2011 Feb-Mar;60(2-3):520-8. doi: 10.1016/j.neuropharm.2010.11.009. Epub 2010 Nov 18. Neuropharmacology. 2011. PMID: 21093460 Free PMC article.
-
Individually monitoring ligand-induced changes in the structure of the GABAA receptor at benzodiazepine binding site and non-binding-site interfaces.Mol Pharmacol. 2008 Jul;74(1):203-12. doi: 10.1124/mol.108.044891. Epub 2008 Apr 18. Mol Pharmacol. 2008. PMID: 18424553 Free PMC article.
-
Combining Mutations and Electrophysiology to Map Anesthetic Sites on Ligand-Gated Ion Channels.Methods Enzymol. 2018;602:369-389. doi: 10.1016/bs.mie.2018.01.014. Epub 2018 Feb 28. Methods Enzymol. 2018. PMID: 29588039 Free PMC article. Review.
-
Structural studies of the actions of anesthetic drugs on the γ-aminobutyric acid type A receptor.Anesthesiology. 2011 Dec;115(6):1338-48. doi: 10.1097/ALN.0b013e3182315d93. Anesthesiology. 2011. PMID: 21881491 Free PMC article. Review.
Cited by
-
Development of contrast mechanisms in humans: a VEP study.Optom Vis Sci. 2009 Jun;86(6):708-16. doi: 10.1097/OPX.0b013e3181a61673. Optom Vis Sci. 2009. PMID: 19417712 Free PMC article.
-
Rosmarinic Acid Potentiates Pentobarbital-Induced Sleep Behaviors and Non-Rapid Eye Movement (NREM) Sleep through the Activation of GABAA-ergic Systems.Biomol Ther (Seoul). 2017 Mar 1;25(2):105-111. doi: 10.4062/biomolther.2016.035. Biomol Ther (Seoul). 2017. PMID: 27469144 Free PMC article.
-
2-(4-methyl-thiazol-5-yl) ethyl nitrate maleate-potentiated GABAA receptor response in hippocampal neurons.CNS Neurosci Ther. 2018 Dec;24(12):1231-1240. doi: 10.1111/cns.13033. Epub 2018 Jul 24. CNS Neurosci Ther. 2018. PMID: 30039924 Free PMC article.
-
Seeking potential anticonvulsant agents that target GABAA receptors using experimental and theoretical procedures.J Comput Aided Mol Des. 2014 Dec;28(12):1217-32. doi: 10.1007/s10822-014-9798-z. Epub 2014 Oct 9. J Comput Aided Mol Des. 2014. PMID: 25298123
-
Different residues in the GABAA receptor benzodiazepine binding pocket mediate benzodiazepine efficacy and binding.Mol Pharmacol. 2011 Jul;80(1):14-22. doi: 10.1124/mol.110.069542. Epub 2011 Mar 29. Mol Pharmacol. 2011. PMID: 21447642 Free PMC article.
References
-
- Boileau AJ, Kucken AM, Evers AR, Czajkowski C. Molecular dissection of benzodiazepine binding and allosteric coupling using chimeric gamma-aminobutyric acidA receptor subunits. Mol Pharmacol. 1998;53:295–303. - PubMed
-
- Boileau AJ, Baur R, Sharkey LM, Sigel E, Czajkowski C. The relative amount of cRNA coding for gamma2 subunits affects stimulation by benzodiazepines in GABA(A) receptors expressed in Xenopus oocytes. Neuropharmacology. 2002;43:695–700. - PubMed
-
- Draguhn A, Verdorn TA, Ewert M, Seeburg PH, Sakmann B. Functional and molecular distinction between recombinant rat GABAA receptor subtypes by Zn2+ Neuron. 1990;5:781–788. - PubMed
-
- Gao F, Bren N, Burghardt TP, Hansen S, Henchman RH, Taylor P, McCammon JA, Sine SM. Agonist-mediated conformational changes in acetylcholine-binding protein revealed by simulation and intrinsic tryptophan fluorescence. J Biol Chem. 2005;280:8443–8451. - PubMed
Publication types
MeSH terms
Substances
Grants and funding
LinkOut - more resources
Full Text Sources
Miscellaneous