. 2008 Mar 26;28(13):3500-9.
doi: 10.1523/JNEUROSCI.5239-07.2008.

Masking of the endoplasmic reticulum retention signals during assembly of the NMDA receptor

Affiliations

Masking of the endoplasmic reticulum retention signals during assembly of the NMDA receptor

Martin Horak et al. J Neurosci. .

Abstract

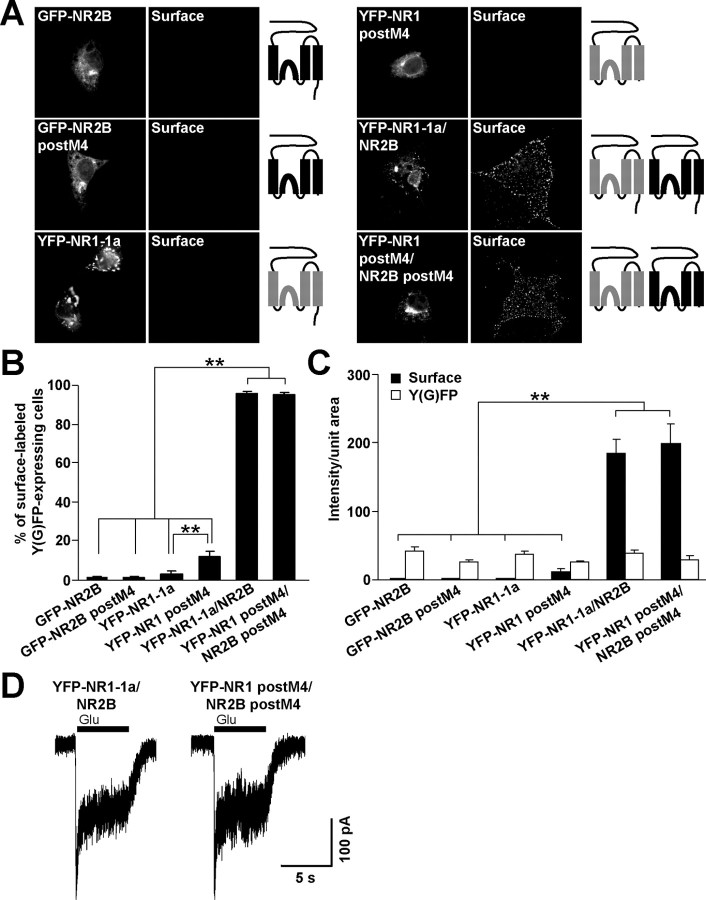
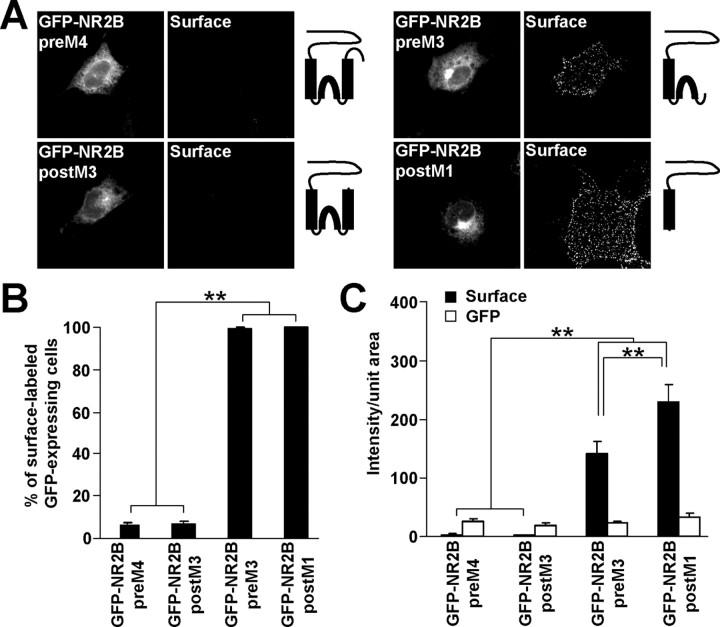
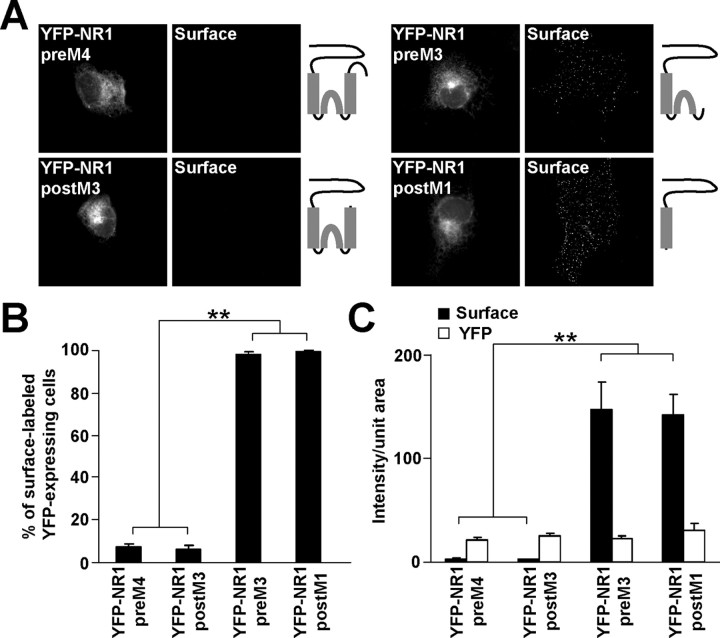
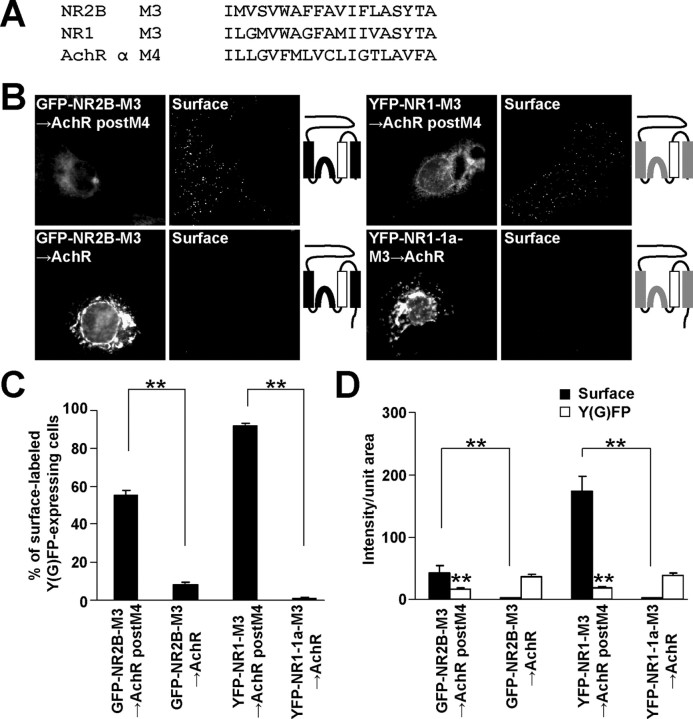
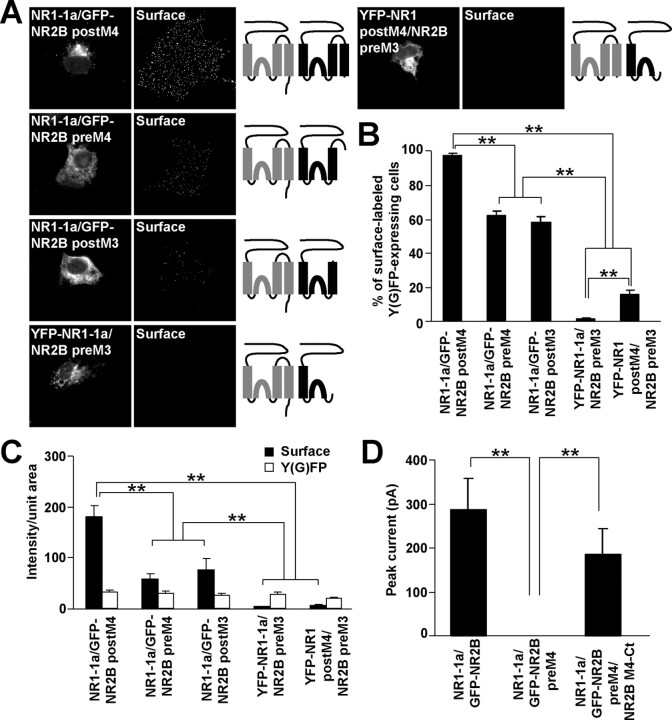
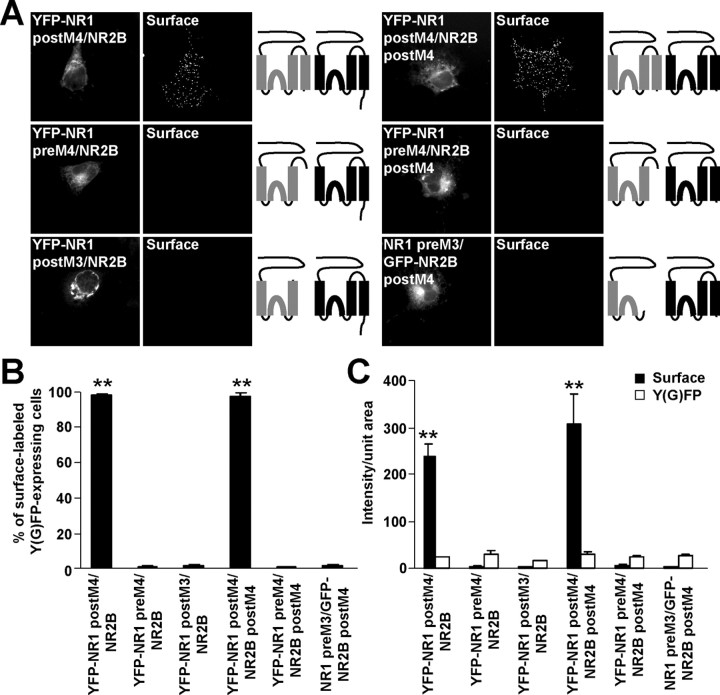
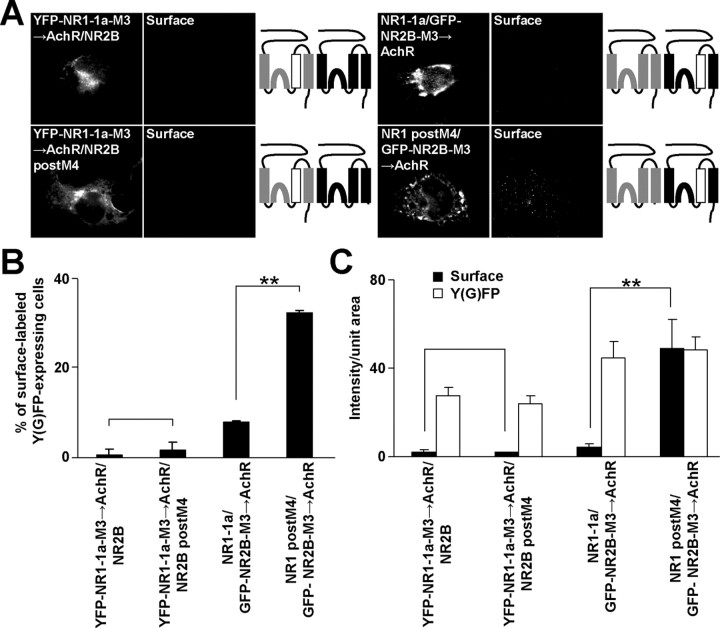
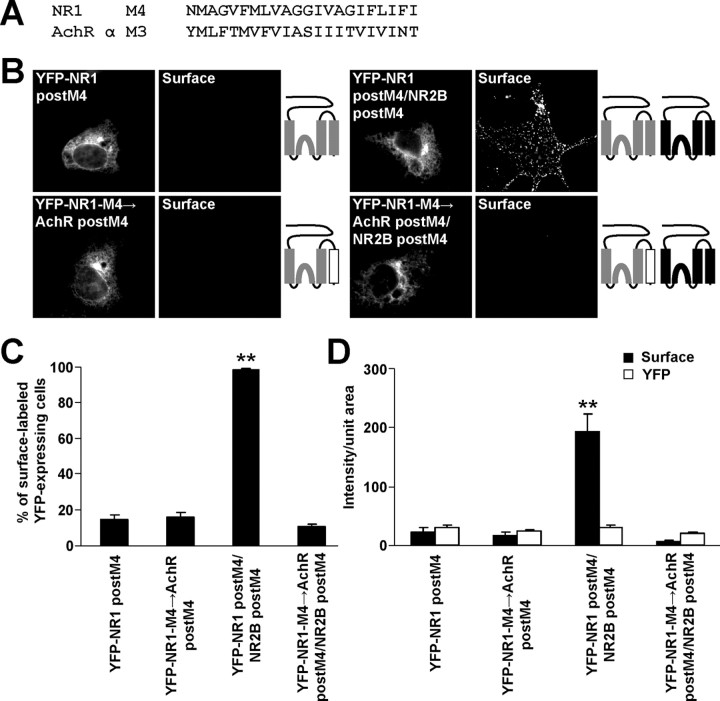
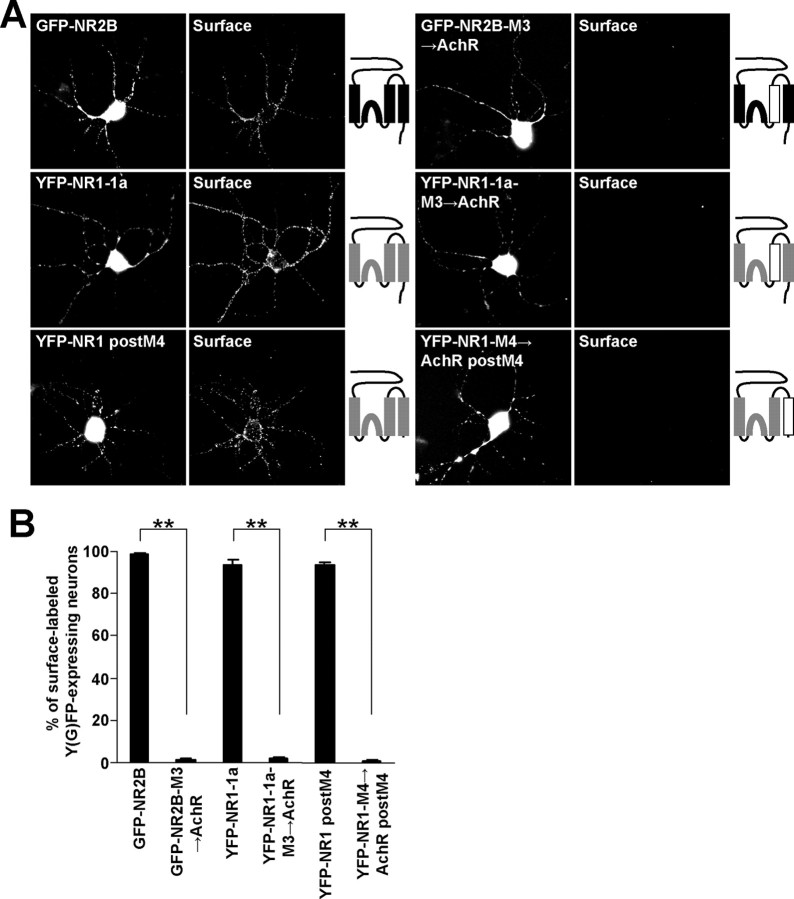
NMDA receptors are glutamate-gated ion channels that play important roles in synaptic transmission and excitotoxicity. The functional NMDA receptor is thought to be a heterotetramer composed mainly of two NR1 and two NR2 subunits. Although it is generally accepted that only correctly assembled NMDA receptors can pass the ER quality control, the mechanism underlying this process is not well understood. Using truncated and chimeric NMDA receptor subunits expressed in heterologous cells and cortical neurons, we found that the third membrane domains (M3) of both NR1 and NR2B contain signals that cause the unassembled subunits to be retained in the ER. M3 of both NR1 and NR2B and, M4 of NR1, are necessary for masking ER retention signals found in M3. Thus, our data reveal a critical role of the membrane domains in the assembly of functional NMDA receptors.


Figures

Figure 1.
Figure 1.
NR2B and NR1 subunits truncated after M4 are localized intracellularly. A, COS7 cells transfected with indicated cDNAs were surface stained with rabbit anti-GFP antibodies. Schematic diagrams show the structure of NR2B (black) and NR1 (gray) subunits. B, The percentages of cells having surface staining were determined for >300 Y(G)FP-expressing cells for each combination of NMDA receptor subunits in three experiments. The bar graphs represent mean ± SEM. **p < 0.001, ANOVA. C, Data represent mean ± SEM of fluorescence intensities per unit area obtained for surface (black) or total Y(G)FP (white) expression. More than 45 Y(G)FP-expressing cells for each combination of cDNAs were analyzed in three experiments. **p < 0.001, ANOVA. D, Whole-cell patch-clamp recordings were performed from HEK293 cells cotransfected with YFP-NR1-1a/NR2B or YFP-NR1 postM4/NR2B postM4. Representative traces for both combinations are shown. Currents were elicited with 5 s applications of 1 mm glutamate and 1 mm glycine (indicated by filled bar). Quantitative analysis of the NMDA receptor mediated currents revealed that the mean peak current amplitudes were not significantly different between YFP-NR1-1a/NR2B and YFP-NR1 postM4/NR2B postM4; n = 8; p > 0.05, unpaired t test.
Figure 2.
Figure 2.
NR2B M3 contains an ER retention signal. A, COS7 cells transfected with GFP-NR2B truncations were stained for surface GFP. Schematic diagrams show the structure of GFP-NR2B truncation constructs. B, The percentages of cells having surface staining were determined for >300 GFP-expressing cells for each construct in three experiments. The bar graph represents mean ± SEM. C, Data represent mean ± SEM of fluorescent intensities per unit area obtained for surface (black) or total GFP (white) expression. More than 45 GFP-expressing cells for each construct were analyzed in three experiments. **p < 0.001, ANOVA.
Figure 3.
Figure 3.
NR1 M3 contains an ER retention signal. A, Live COS7 cells expressing YFP-NR1 truncations were labeled with polyclonal anti-GFP antibodies. Schematic diagrams show the structure of YFP-NR1 truncations. B, The percentages of surface labeled cells were determined for >300 YFP-positive cells for each construct in three experiments. Data represent mean ± SEM. C, Surface (black) and total (white) expression of YFP-NR1 truncations is shown. Data represent mean ± SEM of fluorescence intensities per unit area obtained from at least 45 YFP-expressing cells for each construct in three experiments. **p < 0.001, ANOVA.
Figure 4.
Figure 4.
The substitution of M3 for AchR α M4 facilitates the surface expression of NR1 postM4 and NR2B postM4. A, The amino acid sequences of the NR2B M3, NR1 M3 and AchR α M4 are shown. B, COS7 cells transfected with indicated cDNAs were immunostained for surface Y(G)FP. Schematic diagrams of membrane topology of NR2B (black) and NR1 (gray) subunits with replaced M3 for AchR α M4 (white) are shown. C, Plotted data represent mean ± SEM of the percentages of surface labeled Y(G)FP-expressing cells determined for each chimera from >300 cells in three experiments. D, Quantifications of NMDA-AchR chimeric receptor surface (black) and total Y(G)FP (white) expressions are shown. The surface and total expression levels of both GFP-NR2B-M3→AchR postM4 and YFP-NR1-M3→AchR postM4 were compared with their full-length variants (in mean ± SEM of fluorescence intensities per unit area; n >45 cells in three experiments). **p < 0.001, unpaired t test.
Figure 5.
Figure 5.
NR2B M3 is a necessary structural component for negating the NR1 M3 ER retention signal. A, COS7 cells transfected with indicated combinations of cDNAs were stained for surface GFP. Schematic diagrams of membrane topology of NR1 (gray) and NR2B (black) subunits are shown. B, Bar graph represents the percentages of transfected COS7 cells exhibiting the surface staining in mean ± SEM; n >300 cells for each combination of cDNAs in three experiments. C, Quantification of surface (black) and total Y(G)FP (white) expression of indicated combinations of cDNAs. Data show mean ± SEM of fluorescence intensities of >45 transfected cells measured in three experiments. D, GFP-NR2B preM4 can form a functional channel after coexpression with NR2B M4-Ct and NR1-1a. Currents evoked by the application of 1 mm glutamate and 1 mm glycine were recorded from HEK293 cells expressing indicated combinations of cDNAs. The mean peak current amplitudes ± SEM are shown; n = 6. **p < 0.001, ANOVA.
Figure 6.
Figure 6.
NR1 M4 is necessary for masking the NR2B M3 ER retention signal. A, Live cells transfected with indicated combinations of NR1 and NR2B constructs were immunostained with anti-GFP antibodies. Schematic drawings of membrane topology of NR1 (gray) and NR2B (black) subunits are shown. B, Data represent the percentages of surface labeled cells expressing indicated NMDA receptor subunits (in mean ± SEM; n >300 cells for each combination of cDNAs in three experiments). C, Each vertical bar represents the mean ± SEM of fluorescent intensities per unit area (n >45 cells for each combination of NMDA receptor subunits in three experiments). **p < 0.001, ANOVA.
Figure 7.
Figure 7.
M3 of NR1 and NR2B are necessary for the negating of the ER retention signals in M3 of NR2B and NR1. A, COS7 cells transfected with indicated combinations of NMDA receptor subunits were immunostained for surface GFP. Schematic drawings of membrane topology of NR1 (gray) and NR2B (black) subunits with replaced M3 for AchR α M4 (white) are shown. B, The percentages of surface-labeled transfected cells determined for each NR1/NR2 combination from >300 cells in three experiments are shown in mean ± SEM. C, Data represent mean ± SEM of surface (black) and total (white) fluorescence intensities per unit area of indicated combinations of subunits; n >45 cells in three experiments. **p < 0.001, unpaired t test.
Figure 8.
Figure 8.
The replacement of NR1 M4 for AchR α M3 inhibits surface targeting of the NMDA receptors. A, The amino acid sequences of the NR1 M4 and AchR α M3 are shown. B, COS7 cells transfected with indicated combinations of cDNAs were immunostained for surface YFP. Schematic diagrams of membrane topology of NR2B (black) and NR1 (gray) subunits with replaced M4 for AchR α M3 (white) are illustrated. C, Bar graph represents the percentages of YFP-expressing COS7 cells exhibiting the surface staining in mean ± SEM; n >300 cells in three experiments. D, Measurements of cell surface (black) and total (white) expressions of indicated NMDA receptor subunit variants. Each vertical bar represents the mean ± SEM of fluorescent intensities per unit area; n >45 cells in three experiments. **p < 0.001, ANOVA.
Figure 9.
Figure 9.
Replacement of both NR2B and NR1 M3 for AchR α M4 and NR1 M4 for AchR α M3 inhibits surface targeting of the NMDA receptors in cortical neurons. A, Cortical neurons transfected with indicated combinations of cDNAs were immunostained for surface Y(G)FP. Schematic diagrams of membrane topology of NR2B (black) and NR1 (gray) subunits with replaced M3 or M4 for AchR α M (white) are shown. B, Bar graph represents the percentages of Y(G)FP-expressing cortical neurons exhibiting the surface staining in mean ± SEM; n >100 neurons in three experiments. **p < 0.001, unpaired t test.

Similar articles

Cited by

References

    1. Ayalon G, Stern-Bach Y. Functional assembly of AMPA and kainate receptors is mediated by several discrete protein-protein interactions. Neuron. 2001;31:103–113. - PubMed
    1. Call ME, Wucherpfennig KW. The T cell receptor: critical role of the membrane environment in receptor assembly and function. Annu Rev Immunol. 2005;23:101–125. - PubMed
    1. Cull-Candy S, Brickley S, Farrant M. NMDA receptor subunits: diversity, development and disease. Curr Opin Neurobiol. 2001;11:327–335. - PubMed
    1. Fukaya M, Kato A, Lovett C, Tonegawa S, Watanabe M. Retention of NMDA receptor NR2 subunits in the lumen of endoplasmic reticulum in targeted NR1 knockout mice. Proc Natl Acad Sci USA. 2003;100:4855–4860. - PMC - PubMed
    1. Furukawa H, Singh SK, Mancusso R, Gouaux E. Subunit arrangement and function in NMDA receptors. Nature. 2005;438:185–192. - PubMed

Publication types

MeSH terms

LinkOut - more resources