

Reconstructing population exposures to environmental chemicals from biomarkers: challenges and opportunities
- PMID: 18368010
- PMCID: PMC3068528
- DOI: 10.1038/jes.2008.9
Reconstructing population exposures to environmental chemicals from biomarkers: challenges and opportunities
Abstract
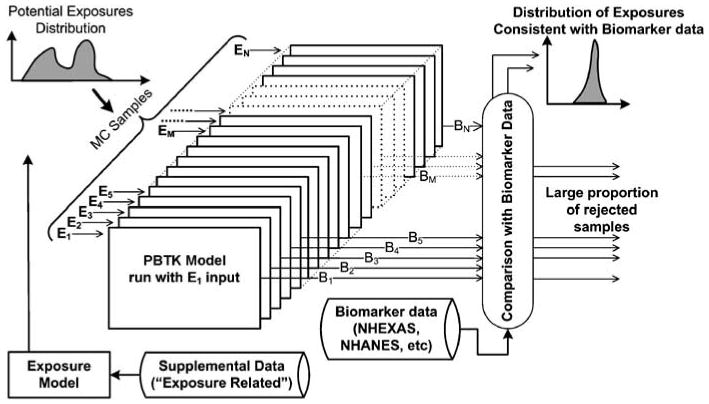
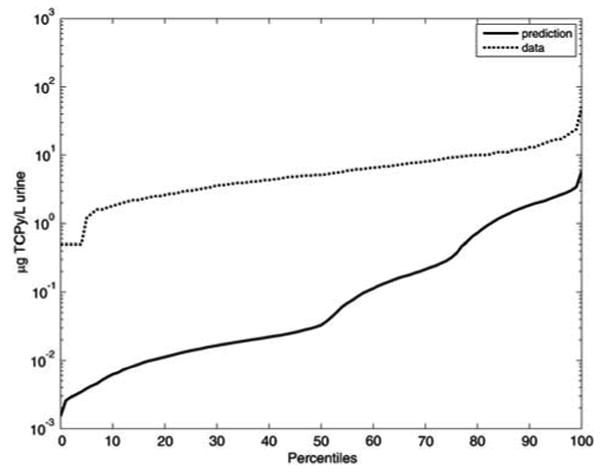
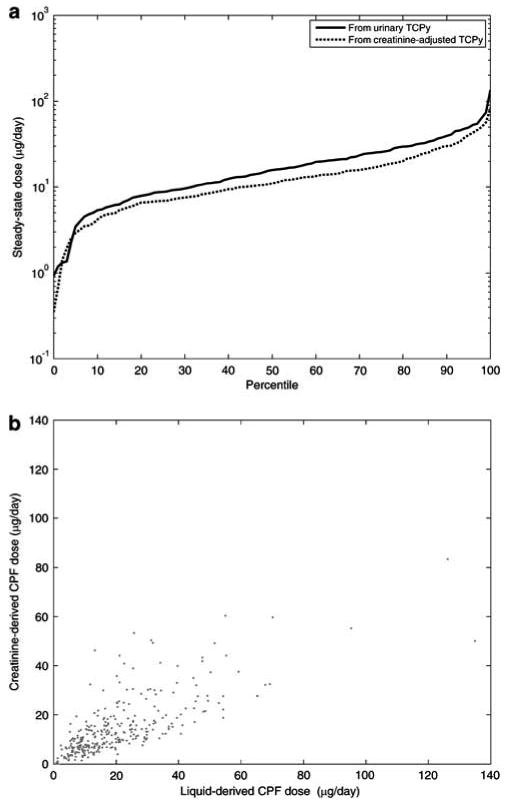
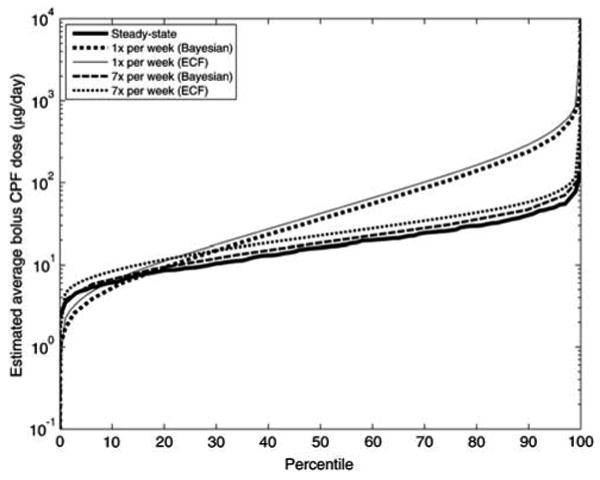
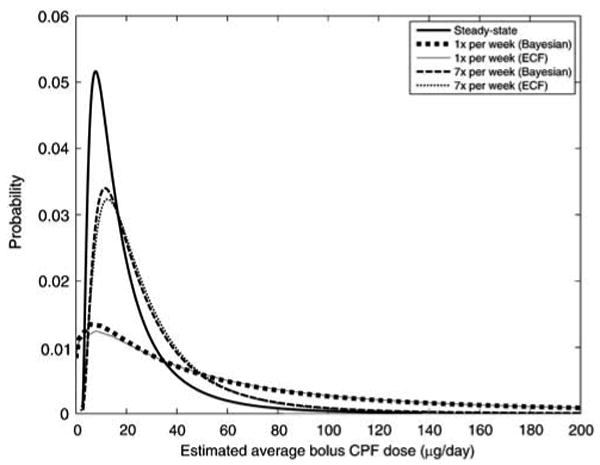
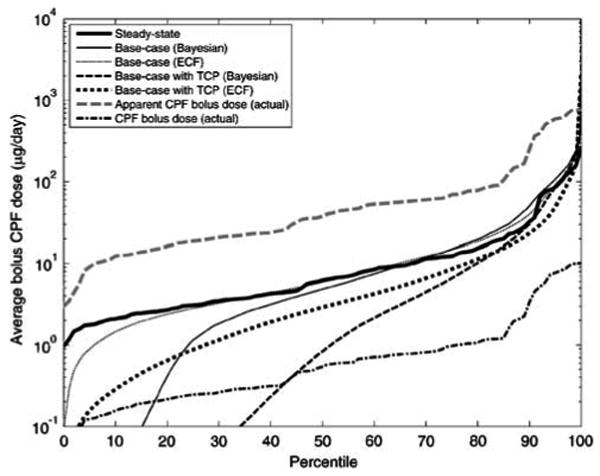
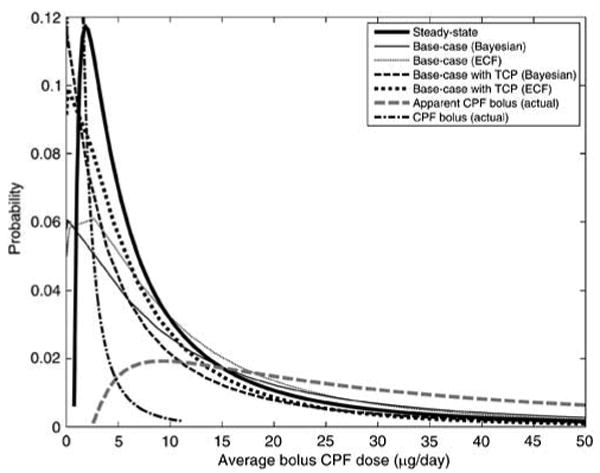
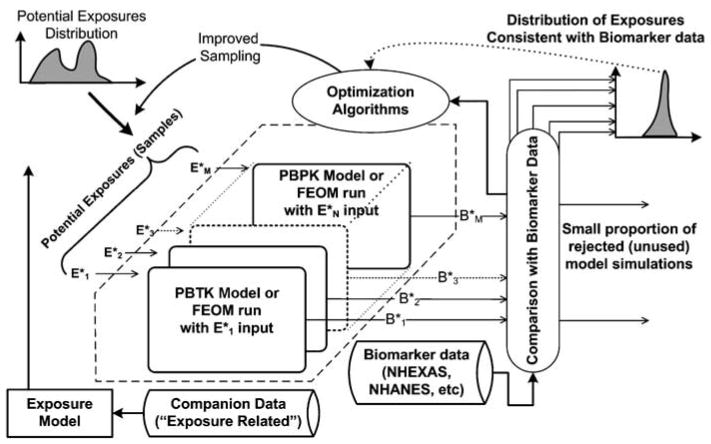
A conceptual/computational framework for exposure reconstruction from biomarker data combined with auxiliary exposure-related data is presented, evaluated with example applications, and examined in the context of future needs and opportunities. This framework employs physiologically based toxicokinetic (PBTK) modeling in conjunction with numerical "inversion" techniques. To quantify the value of different types of exposure data "accompanying" biomarker data, a study was conducted focusing on reconstructing exposures to chlorpyrifos, from measurements of its metabolite levels in urine. The study employed biomarker data as well as supporting exposure-related information from the National Human Exposure Assessment Survey (NHEXAS), Maryland, while the MENTOR-3P system (Modeling ENvironment for TOtal Risk with Physiologically based Pharmacokinetic modeling for Populations) was used for PBTK modeling. Recently proposed, simple numerical reconstruction methods were applied in this study, in conjunction with PBTK models. Two types of reconstructions were studied using (a) just the available biomarker and supporting exposure data and (b) synthetic data developed via augmenting available observations. Reconstruction using only available data resulted in a wide range of variation in estimated exposures. Reconstruction using synthetic data facilitated evaluation of numerical inversion methods and characterization of the value of additional information, such as study-specific data that can be collected in conjunction with the biomarker data. Although the NHEXAS data set provides a significant amount of supporting exposure-related information, especially when compared to national studies such as the National Health and Nutrition Examination Survey (NHANES), this information is still not adequate for detailed reconstruction of exposures under several conditions, as demonstrated here. The analysis presented here provides a starting point for introducing improved designs for future biomonitoring studies, from the perspective of exposure reconstruction; identifies specific limitations in existing exposure reconstruction methods that can be applied to population biomarker data; and suggests potential approaches for addressing exposure reconstruction from such data.
Figures
Comment in
-
microg/kg-day or microg/day? A commentary on Georgopoulos et al., JESEE 2008.J Expo Sci Environ Epidemiol. 2008 Nov;18(6):535; author reply 536-7. doi: 10.1038/jes.2008.52. J Expo Sci Environ Epidemiol. 2008. PMID: 18936758 No abstract available.
References
-
- Ablonczy Z, Lukacs A, Papp E. Application of the maximum entropy method to absorption kinetic rate processes. Biophys Chem. 2003;104(1):249–258. - PubMed
-
- Abramov S, Adamovich A, Inyukhin A, Moskovsky A, Roganov V, Shevchuk E, Shevchuk Y, Vodomerov A. OpenTS: an outline of dynamic parallelization approach. Parallel Comput Technol. 2005;3606:303–312.
-
- ACM. Software from the Transactions on Mathematical Software (TOMS) 2006. http://www.netlib.org/toms/
-
- Allen BC, Hack CE, Clewell HJ. Use of Markov chain Monte Carlo analysis with a physiologically-based pharmacokinetic model of methylmercury to estimate exposures in US women of childbearing age. Risk Anal. 2007;27(4):947–959. - PubMed
Publication types
MeSH terms
Substances
Grants and funding
LinkOut - more resources
Full Text Sources
